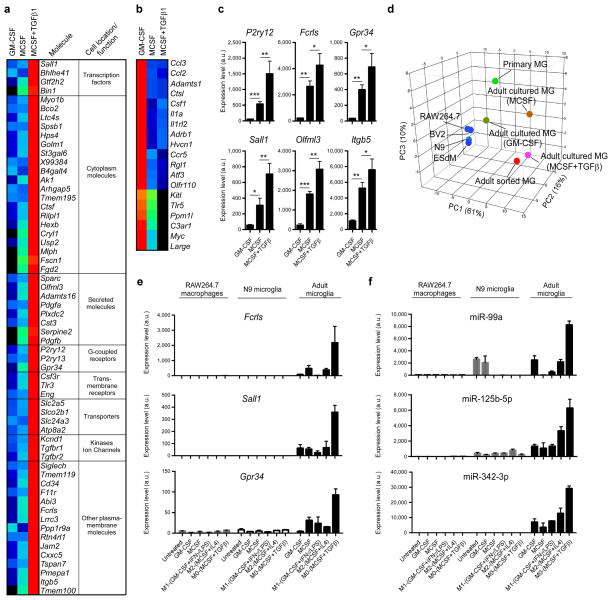
Figure 6. Role of TGF-β in the development of microglia in vitro.
(a and b) MG400 analysis of (a) upregulated microglial genes and (b) downregulated microglial genes in cultured adult microglia in the presence of MCSF and TGF-β1 in comparison to adult microglia cultured in the presence of GM-CSF or MCSF alone (see Source data – Figure 6). One representative of three individual experiments is shown. (c) qPCR analysis of 6 selected microglial genes in cultured adult microglia in the presence of MCSF and TGF-β1. Gene expression level was normalized against Gapdh using ΔCt (n = 6, each biological triplicate consisted of two wells per treatment). Bars show mean normalized intensity ± s.e.m. *P<0.05, **P<0.01, ***P<0.001, F2,15=5.829; 1-Way ANOVA followed by Dunnett’s multiple-comparison post-hoc test. (d) Principal component analysis (PCA) of different cell populations based on MG400 expression profile. (e and f) qPCR analysis of Fcrls, Sall1 and Gpr-34 gene expression (e) and miR-99a, miR-125b-5p and miR-342-3p expression (f) in RAW264.7 macrophages, N9 microglia cell line and adult microglia cultures. Cells were untreated or cultured in the presence of MCSF, GM-CSF, or polarized for 48h to M0 (MCSF+TGF-β1), M1 (GM-CSF+IFNγ+LPS) or M2 (MCSF+IL4) phenotypes. RAW264.7 macrophages and N9 cells survive without MCSF or GM-CFS, whereas adult microglia require either MCSF or GM-CSF. Gene expression level was normalized against Gapdh using ΔCt (n = 3). miRNA expression level was normalized against U6 miRNA using ΔCt (n = 3). Bars show mean ± s.e.m. Shown is one of two individual experiments.

