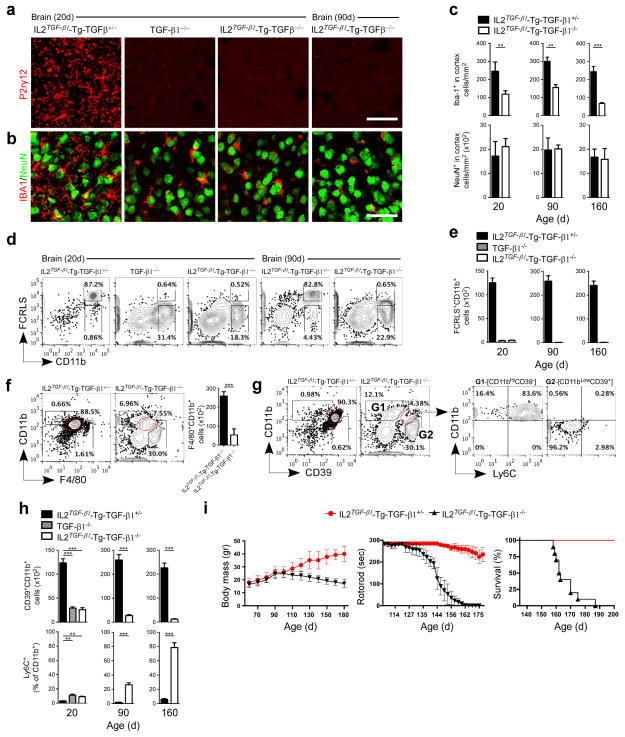
Figure 7. Loss of microglia in CNS-TGF-β1−/− mice.
(a and b) Immunohistochemistry of brain stained with (a) anti-P2ry12 (microglia) and (b) anti-Iba-1 (myeloid cells) and anti-NeuN (neurons) at 20 and 90 days of age (IL2TGF-β1-Tg-TGF-β1+/− and IL2TGF-β1-Tg-TGF-β1−/−) (n = 6) and 20d (TGF-β1−/−) (n = 5) mice. Scale bar, 50 μm. (c) Quantification of Iba-1+ and NeuN+ cells. Data represent mean ± s.e.m. at 20 days **P<0.01, t=13.51; 90 days **P<0.01, t=4.41; and 160 days ***P<0.001, t=11.29. Student’s t test, 2-tailed. (d) Representative FACS analysis of brain-derived mononuclear cells stained for CD11b and FCRLS among CD45+ cells at 20 (n = 5) and 90 (n = 6) days. (e) Quantification of FCRLS+CD11b+ cells at 20 (n = 6), 90 (n = 5) and 160 (n = 5) days. Data represent mean ± s.e.m. (f and g) FACS plots show the percentage and total cell number ± s.e.m. of (f) F4/80+CD11b+ cells (***P<0.001, t=15.60 Student’s t test, 2-tailed) and (g) the percentage of CD39+CD11b+ cells among CD45+ cells at 90 days of age in IL2TGF-β1-Tg-TGF-β1+/− (n = 5) and IL2TGF-β1-Tg-TGF-β1−/− (n = 6) mice. (h) Quantification of CD39+CD11b+ cells among CD45+ cells and Ly6C+ cells as percentage of CD11b+ cells at 20 (n = 6), 90 (n = 5) and 160 (n = 5) days. Data represent mean ± s.e.m. For CD39+CD11b+ cells ***P<0.001, F2,13=12.34; 1-Way ANOVA followed by Dunnett’s multiple-comparison post-hoc test for comparison at 20d and ***P<0.001, t= 20.20 and ***P<0.001, t=26.36 Student’s t test, 2-tailed for comparison at 90d and 160d, respectively. (i) Body mass, rotorod performance and survival in IL2TGF-β1-Tg-TGF-β1+/− and IL2TGF-β1-Tg-TGF-β1−/− mice (n = 10/group).

