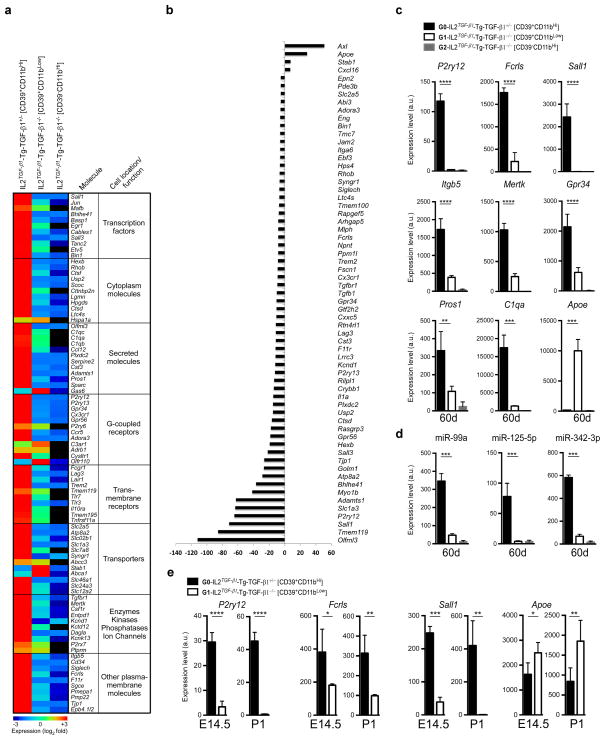
Figure 8. Molecular microglial signature in CNS-TGF-β1 deficient mice.
(a) MG400 profile of brain CD39+CD11b+ cells in IL2TGF-β1-Tg-TGF-β1+/− (n = 3) and IL2TGF-β1-Tg-TGF-β1−/− mice at 60d of age (n = 3) (see Source data – Figure 8). Heatmap of top microglial genes is shown. Results were log-transformed, normalized (to the mean expression of zero across samples) and centered. (b) Affected microglial genes in CD39+CD11b+ cells from and IL2TGF-β1-Tg-TGF-β1−/− mice as compared to IL2TGF-β1-Tg-TGF-β1+/− mice showing at least >5-fold difference. (c and d) qPCR validation of (c) 9 selected microglial genes and (d) 3 miRNAs at 60 days of age. Expression levels were normalized to Gapdh. Data represent mean ± s.e.m. (n = 3 mice per group) for P2ry12, ****P<0.0001, F2,9=335.5; Fcrls, ****P<0.0001, F2,9=221.5; Sall1, ****P<0.0001, F2,9=69.4; Itgb5, ****P<0.0001, F2,9=102.0; Mertk, ****P<0.0001, F2,9=234.8; Gpr34, ****P<0.0001, F2,9=71.5; Pros1, ***P=0.002, F2,9=24.2; C1qa, ****P<0.0001, F2,9=93.4; Apoe, ****P<0.0001, F2,9=110.8; 1-Way ANOVA followed by Dunnett’s multiple-comparison post-hoc test. (e) qPCR validation of 4 selected microglial genes at E14.5 (n = 4) and P1 (n = 5) mice. Data represent mean ± s.e.m. For P2ry12 at E14.5 ****P<0.0001, t=11.91; at P1 ****P<0.0001, t=18.48; For Fcrls at E14.5 *P=0.035, t=3.66; at P1 **P<0.006, t=5.26; For Sall1 at E14.5 ****P<0.0001, t=18.38; at P1 **P=0.0034, t=6.24; For Apoe at E14.5 *P=0.0221, t=2.97; at P1 **P=0.0088, t=3.62; (Student’s t test, unpaired).

