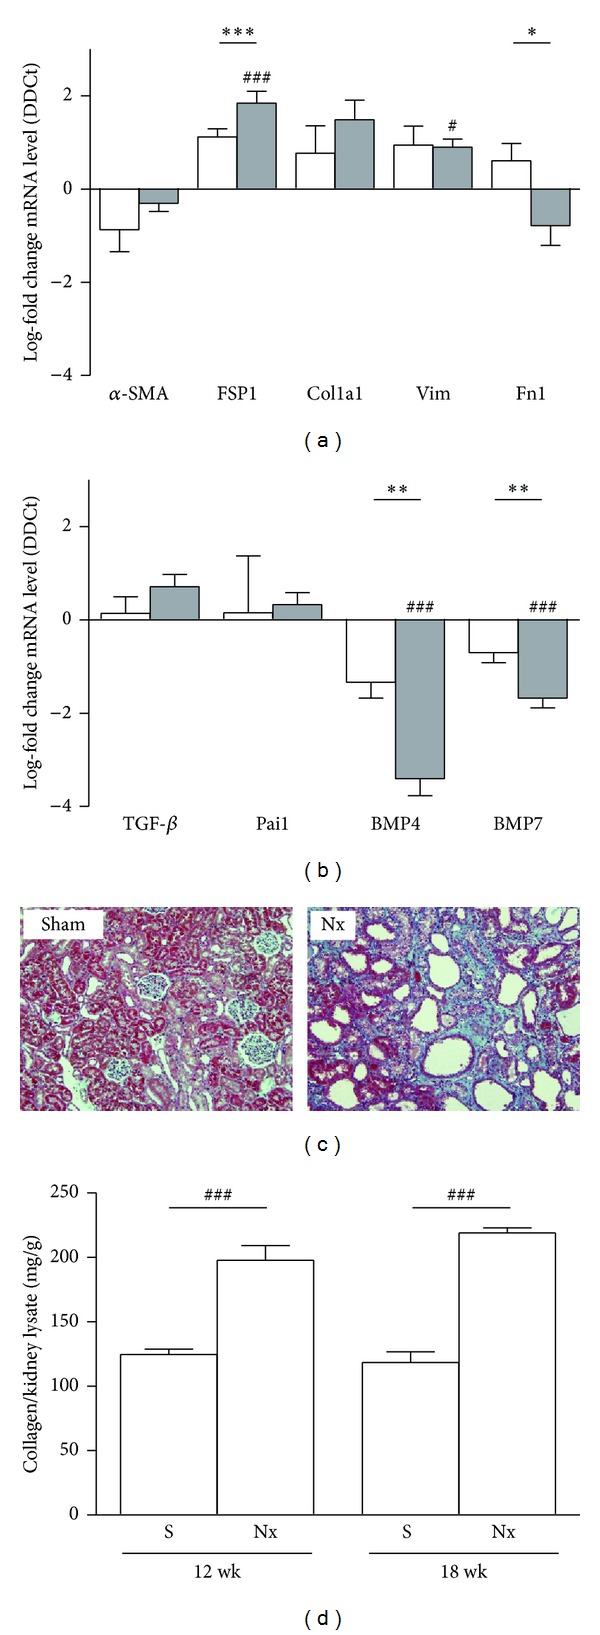
Figure 1.

Assessment of fibrosis in rat 5/6 renal mass reduction model. (a) mRNA expression of general markers of fibroblast activation: alpha smooth muscle actin (α-SMA), fibroblast-specific protein-1 (FSP1), collagen 1a1 (Col1a1), vimentin (Vim), and fibronectin 1 (Fn1). (b) Profibrogenic mediators transforming growth factor-β (TGF-β), plasminogen activator inhibitor-1 (Pai1), and the antifibrotic bone morphogenetic proteins 4 and 7 (BMP4 and BMP7), and in rat kidneys of sham animals and 5/6 mass reduction animals by quantitative real-time PCR (qRT-PCR). Results are derived from 8-9 animals per group after 12 weeks (white columns) and 18 weeks (grey columns) after the surgery. Columns show median of log-fold change for each gene. # P > 0.05 and ### P < 0.001, two-tailed Student's t-test for unpaired observations between S and Nx groups. **P > 0.01 and ***P < 0.001, two-tailed Student's t-test for unpaired observations between 12 and 18 weeks. (c) Masson's trichrome of representative kidneys from sham or nephrectomized (Nx) rats. Representative pictures with focus on the cortex area are given. Green: collagen deposition. (d) Total collagen content was determined using the Sircol Collagen Assay. Columns are showing show median of mg collagen/g kidney lysate. ### P < 0.001, two-tailed Student's t-test for unpaired observations between S and Nx groups.
