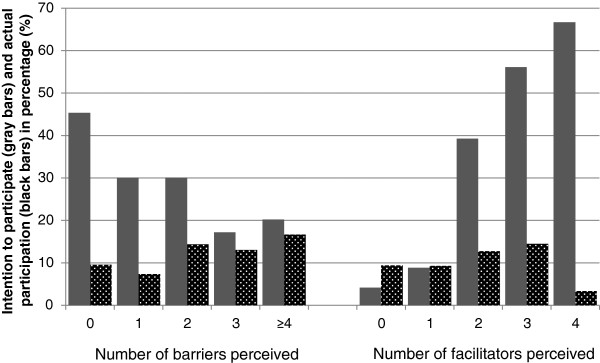
Figure 1.

Positive intention and actual participation according to the number of barriers and facilitators perceived. The percentage of employees who had a positive intention (gray) and who actually participated (black) according to by the number of barriers (left) and facilitators (right) perceived by the employees.
