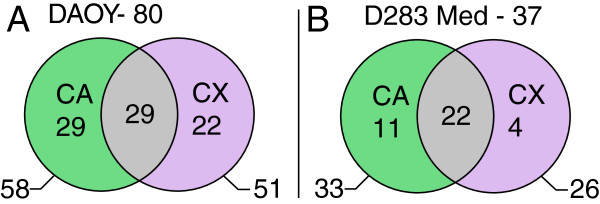
Figure 1.

Summary of detected changes in the expression of 440 cancer-related genes after the combined treatment of the Daoy (A) and D283 Med (B) cell lines. The black circles indicate the total number of genes with changed expression after combinations of ATRA with CA or CX. The green areas indicate the number of genes with changed expression after combined treatment with ATRA and CA only. Similarly, the violet areas indicate the number of genes with changed expression after combined treatment with ATRA and CA only. The gray overlays indicate the number of genes that demonstrated changed expressions after treatment with ATRA in both combinations; i.e., with CA as well as with CX.
