
Figure 11.
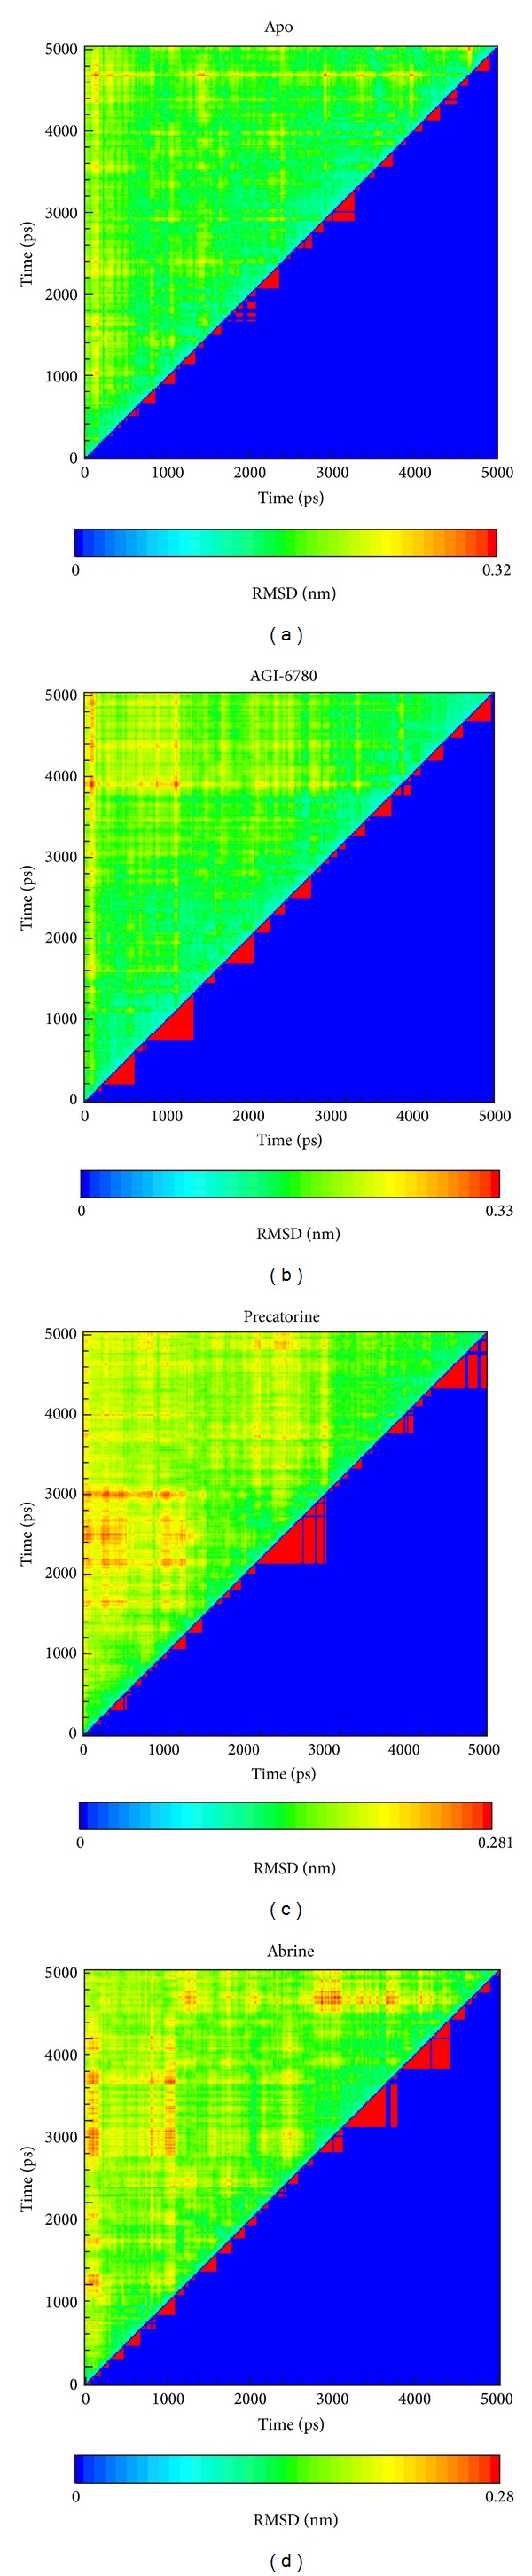
Root-mean-square deviation value (upper left half) and graphical depiction of the clusters with cutoff 0.105 nm (lower right half) for IDH2 R140Q mutant proteins and protein complexes with AGI-6780, precatorine, and abrine.
Official websites use .gov
A
.gov website belongs to an official
government organization in the United States.
Secure .gov websites use HTTPS
A lock (
) or https:// means you've safely
connected to the .gov website. Share sensitive
information only on official, secure websites.
Root-mean-square deviation value (upper left half) and graphical depiction of the clusters with cutoff 0.105 nm (lower right half) for IDH2 R140Q mutant proteins and protein complexes with AGI-6780, precatorine, and abrine.