Figure 1.

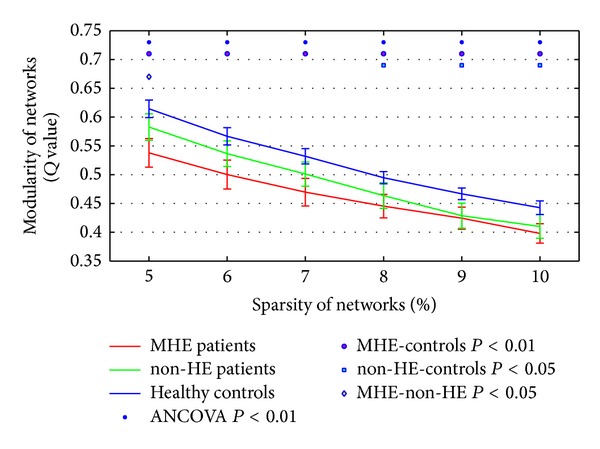
The network modularity Q values of healthy controls, non-HE and MHE patients from sparsity of 5% to sparsity of 10% at 1% intervals.

The network modularity Q values of healthy controls, non-HE and MHE patients from sparsity of 5% to sparsity of 10% at 1% intervals.