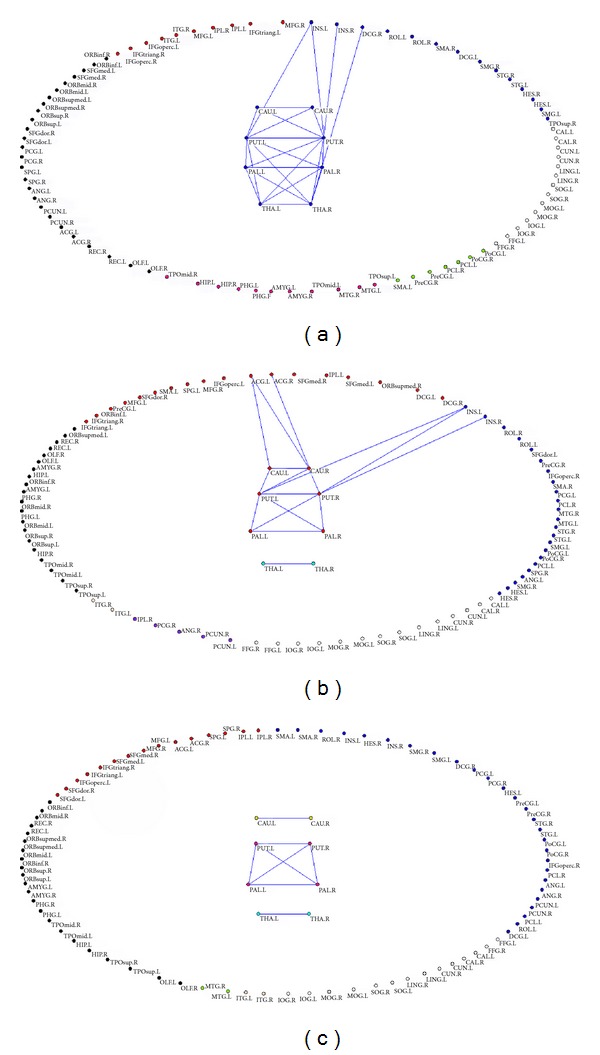
Figure 3.

The community structures of healthy control, non-HE and MHE groups for mean functional networks at sparsity of 8%. (a) The community structure of healthy control group; (b) the community structure of non-HE group; (c) the community structure of MHE group.
