
Figure 1.
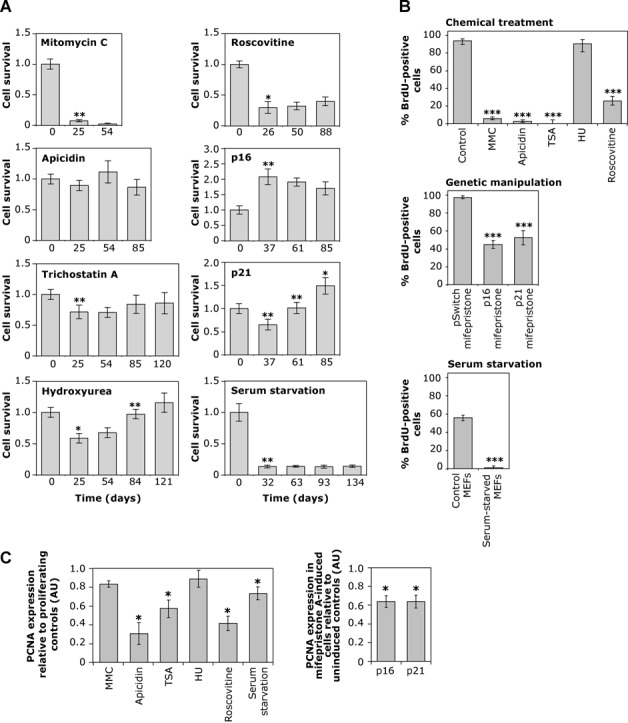
Analysis of cell cycle arrest. (A) Cell culture dynamics. The graphs show mean cell survival (±SD) of six replicate cultures over time. Cell survival of chemically treated cultures, cells expressing p16INK4a and p21WAF1 following mifepristone A induction, and serum-starved MEFs, was calculated relative to the day zero culture. Statistically significant differences between two consecutive time points are illustrated with asterisks (*, P < 0.05; **, P < 0.01; Mann–Whitney U test). (B) Proportion of BrdU positive cells. The histograms show the percentage of BrdU immunopositive cells and the error bars indicate the 95% confidence intervals for control and treated cultures. Statistically significant reductions in BrdU staining relative to controls are indicated (***, P < 0.001; Fisher's exact test). (C) Relative PCNA expression levels. The graph on the left shows the quantitative analysis of PCNA protein expression levels in arrested cells relative to the corresponding proliferating controls. The graph on the right shows the quantitative analysis of PCNA protein expression (±SD) in mifepristone A-induced cells, co-transfected with pSwitch regulatory plasmid and pGENE/V5-His A/p16INK4a (p16) or pGENE/V5-His A/p21WAF1 (p21), relative to un-induced transfected controls. Statistically significant reductions in PCNA protein levels relative to proliferating controls are indicated (*, P < 0.05; Mann–Whitney U test). AU, arbitrary units.