
Figure 2.
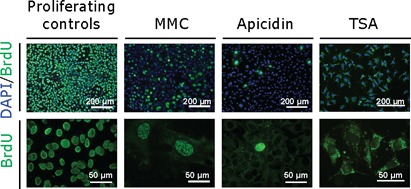
BrdU incorporation patterns. To measure levels of DNA synthesis we performed a BrdU incorporation assay. Representative low magnification images (left) reveal the relative proportion of BrdU immunostaining (green) nuclei counter-stained with DAPI (blue). Representative high-magnification images (right) illustrate BrdU immunostaining patterns within individual cells and reveal differences between chemical treatments.