
Figure 2.
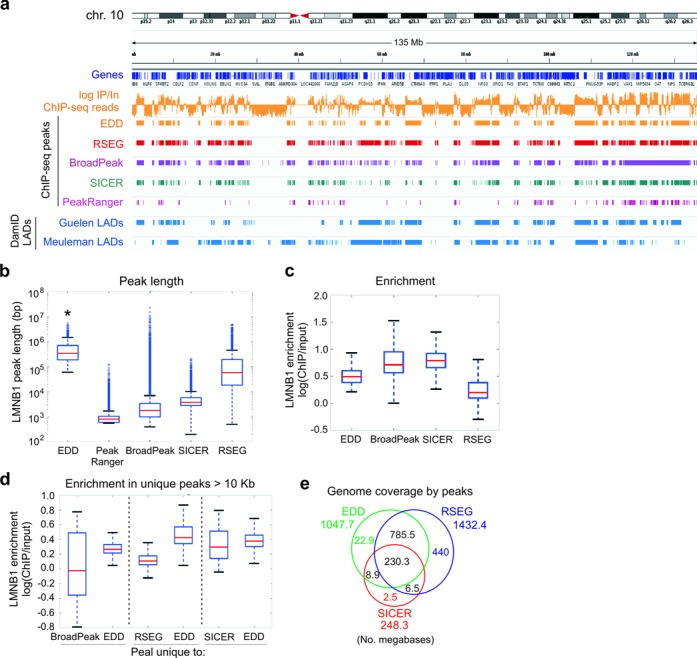
Benchmarking of EDD and other broad peak callers on LMNB1 ChIP-seq data. (a) IGV browser views of LMNB1 occupancy and LADs on chromosome 10, detected by EDD, RSEG, BroadPeak, SICER and PeakRanger from LMNB1 ChIP-seq data from human fibroblasts (6), and by DamID in human fibroblasts (Guelen LADs) (9) and HT1080 human fibrosarcoma cells (Meuleman LADs) (11) (DamID LADs). Tracks also show genes and LMNB1 log ChIP/Input ratios. (b) Median LMNB1 peak length detected by indicated peak callers (P = 0.000…; Wilcoxon rank-sum tests; see Supplementary Table S3 for W- and P-values). (c) Median LMNB1 enrichment within peaks detected by indicated peak callers. (d) Median LMNB1 enrichment within peaks uniquely detected by EDD versus BroadPeak, RSEG, or SICER. (e) Venn diagram analysis of genome coverage under EDD, RSEG and SICER peaks. ChIP-seq data shown are all from replicate 3 of the Sadaie LMNB1 data set (6); similar results were obtained for replicates 1 and 2 in this data set (not shown).