
Figure 5.
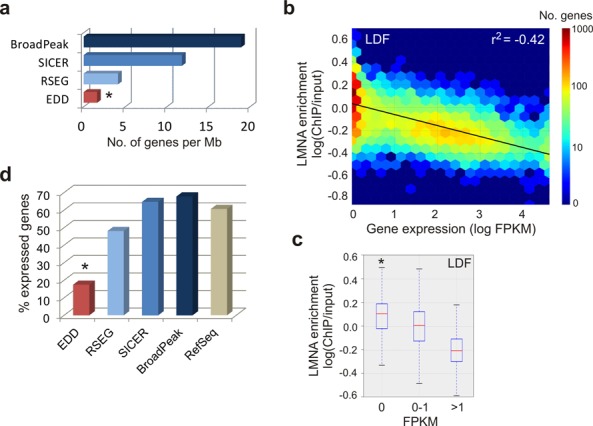
LMNA LADs identified by EDD are gene-poor and overall transcriptionally inactive. (a) Number of protein-coding genes per megabase covered by indicated peak callers in AD04DF (*P < 0.001, Wilcoxon rank-sum test; W = 0 for each comparison). Results for the other data sets are shown in Supplementary Figure S1b. (b) Heat map of LMNA enrichment on protein-coding genes of > 1 Kb as a function of gene expression level (LDF). (c) Median LMNA enrichment on protein-coding genes of > 1 Kb that are repressed (FPKM = 0; 4789 genes), weakly expressed (FPKM = 0–1; 2179 genes) and highly expressed (FPKM > 1; 2097 genes). *P < 10−50 relative to FPKM = 0–1 or FPKM >1; Wilcoxon rank-sum test: see Supplementary Table S3 for W- and P-values. Data for AD04DF are shown in Supplementary Figure S2a and b and Table S3. (d) Percentage of expressed protein-coding genes (FPKM > 0) in peaks discovered by indicated peak callers and among all protein-coding genes; *P = 10−321, Fisher's exact test relative to all genes.