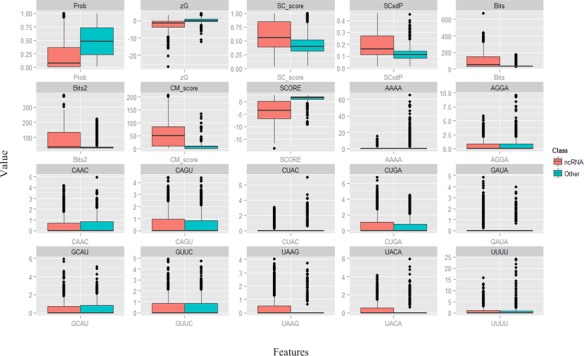
Figure 1.

Boxplots showing the spread of the training data for each of the 20 selected features: Prob, zG, SC_score, SCxdP, Bits, CM_score, Bits2, SCORE, AAAA, AGGA, CAAC, CAGU, CUAC, CUGA, GAUA, GCAU, GUUC, UAAG, UACA and UUUU. For each plot, the left side represents the ncRNA class, and the right side represents other classes.
