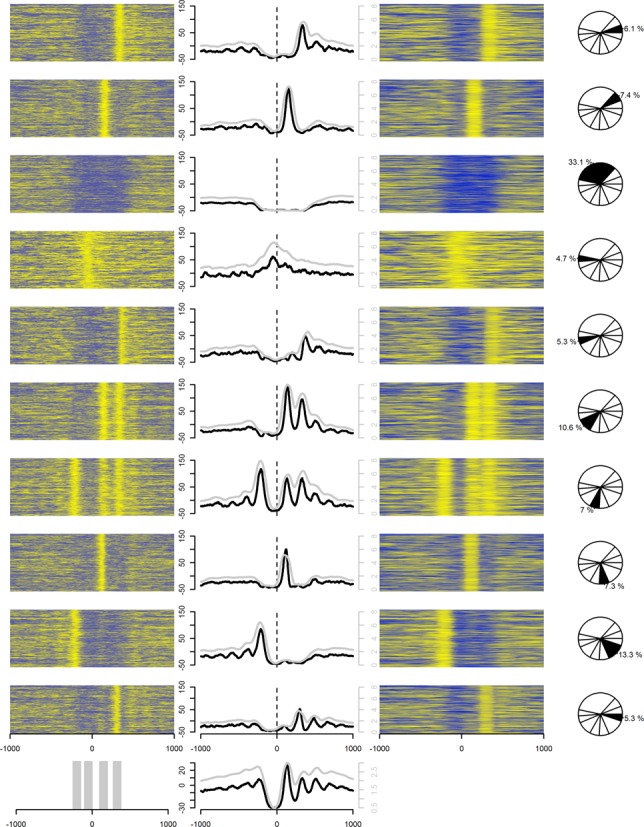
Figure 2.

Heat maps of log-odds values (left column) and counts of fragment-length extended reads, combined signal, (right column) in 2-kb windows around TSS of highly expressed genes (top 5000). Their average values are also shown (middle column) in 10 K-means clusters (rows) inferred from discretized (0 or 1) log-odds data. The clusters were inferred using the data within the gray-marked regions in the bottom panel, leftmost figure. The middle figure in the bottom panel shows the combined average of all 10 clusters. Black lines (left vertical axes) and gray lines (right vertical axes) in the middle column depict the average of log-odds values and the combined signals, respectively, within each cluster. Yellow colors indicate high values while blue colors indicate low values.
