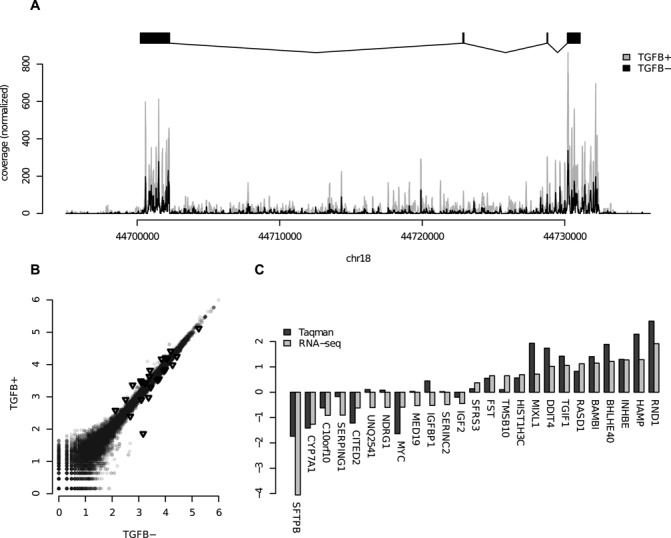
Figure 8.

(A) Coverage plots of RNA-seq data over the SMAD7 gene. The TGFβ stimulated (TGFB+) data have been normalized to the same sequencing depth as the unstimulated (TGFB−). (B) Scatter plot of RPKM-counts over genes for TGFB+ and TGFB−. The genes selected for Taqman validation are marked with black triangles. (C) Taqman validation results for 25 selected genes. The RNA-seq is represented as log2 of sequence depth normalized fold change between TGFB+ and TGFB−, and the Taqman values are also log2 of fold change between TGFB+ and TGFB−.
