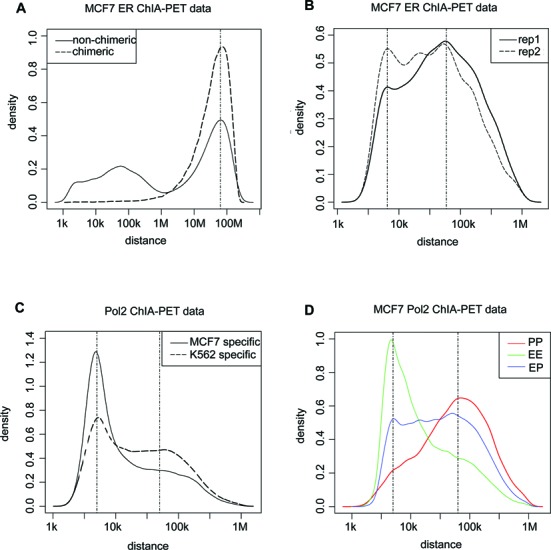
Figure 1.

Characteristic distance features of ChIA-PET data. (A) Log10-distance distribution between the two ends of chimeric and non-chimeric PETs, where non-chimeric PETs presented a trimodal distribution. The third peak at right of non-chimeric PETs was close to that of chimeric PETs. (B) Log10-distance distribution between the two ends of PETs 2+ clusters of MCF7 ERα ChIA-PET data for two replicates. Interactions with span more than 1 Mbps were excluded. Peak positions located at 3.8 and 4.77. (C) Log10-distance distribution between the two ends of PETs 2+ clusters from MCF7-specific and K562-specific Pol2 ChIA-PET data. Peak positions located at 3.7 and 4.64. (D) Log10-distance distribution of EE, PP and EP interactions from MCF7 Pol2 ChIA-PET data. Positions of peaks for EE and PP interactions were 3.7 and 4.8, respectively.
