Figure 3.

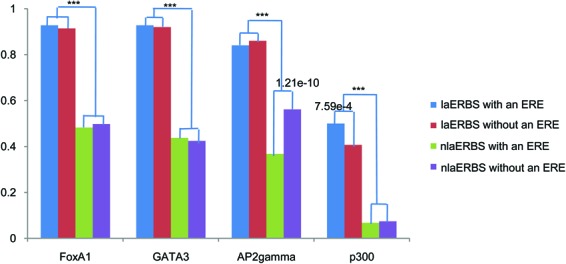
Proportion of FoxA1, GATA3, AP2γ and p300 binding peaks that overlapped with four groups of ERBSs. P-values smaller than 0.05 were listed above the bars, which were given by one-tailed Fisher test in R. ***P < 2.2e−16.

Proportion of FoxA1, GATA3, AP2γ and p300 binding peaks that overlapped with four groups of ERBSs. P-values smaller than 0.05 were listed above the bars, which were given by one-tailed Fisher test in R. ***P < 2.2e−16.