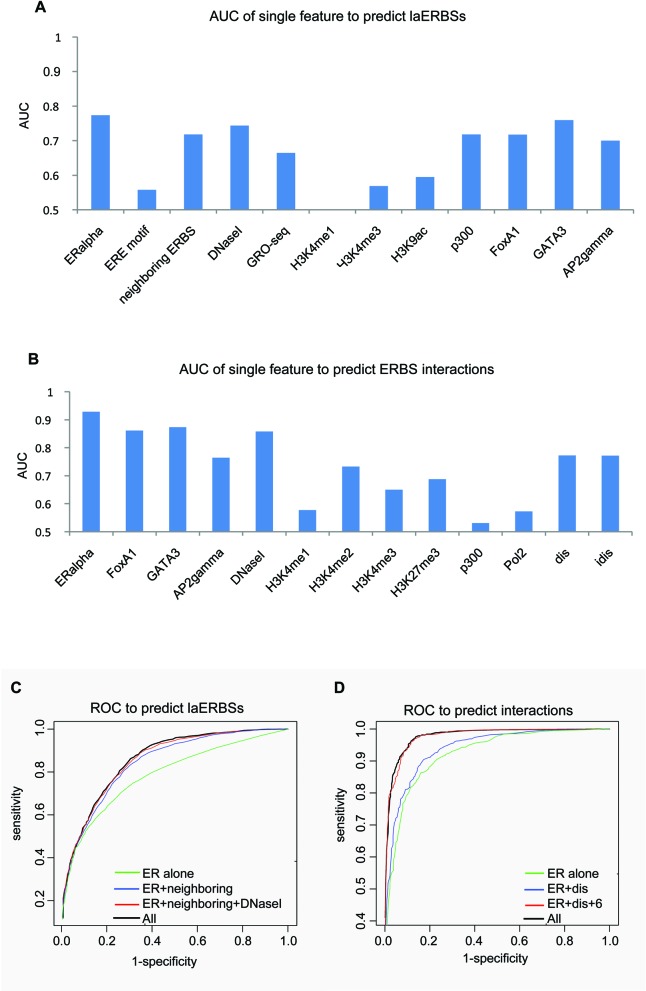
Figure 4.
AUC and ROC curves for the predictors. (A) AUC for each feature to predict laERBSs. Here AUC was computed as the average area under ROC curve for predictors with each single feature for 5-fold cross-validation. (B) AUC for each feature to predict interactions between predicted laERBSs. AUC was computed in the same manner as in (A). "dis" is distance between two ERBSs and "idis" is the inverse distance. (C) ROC trained for ERα alone, ERα+distance of neighboring ERBSs, ERα+distance of neighboring ERBSs+DNase-seq and all the features. (D) ROC trained for ERα alone, ERα+distance and ERα+distance+6 significant features and all the features.

