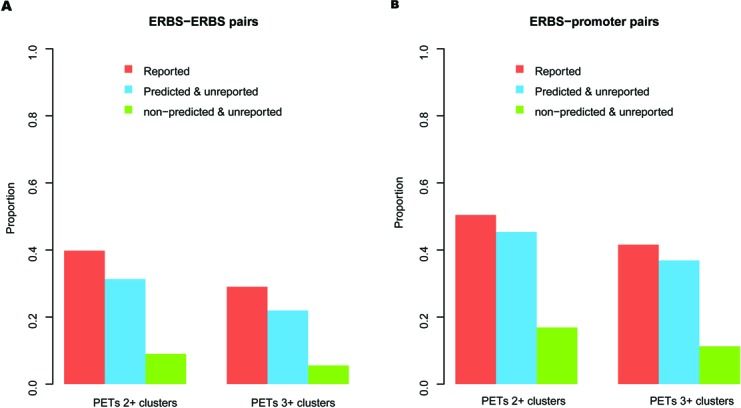
Figure 5.

Evaluation of novo predicted interactions by other independent data sets. (A) Proportion of reported, predicted and unreported and rest of the candidate (non-predicted and unreported) ERBS–ERBS pairs that overlapped with Pol2 PETs 2+ and PETs 3+ clusters, respectively. (B) Proportion of reported, predicted and unreported and rest of the candidate (non-predicted and unreported) ERBS–promoter pairs that overlapped with Pol2 PETs 2+ and PETs 3+ clusters, respectively.
