
Figure 2.
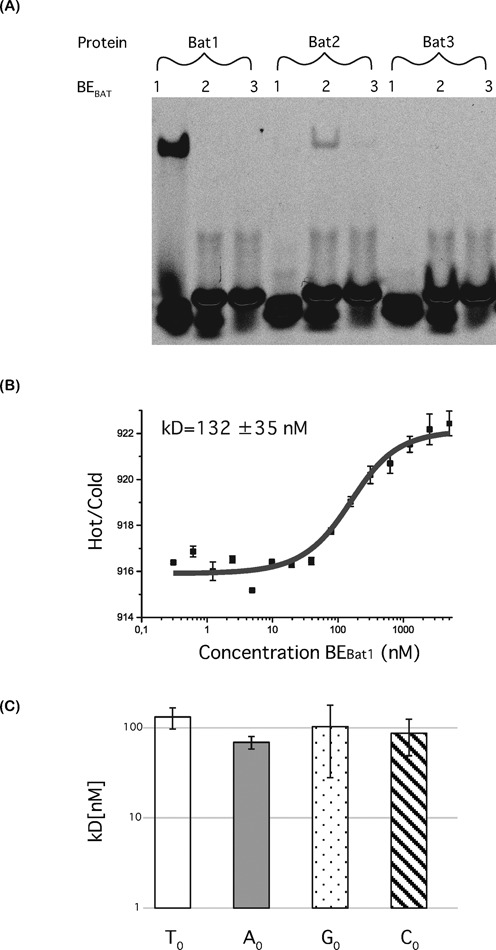
In vitro interaction studies of Bat proteins with predicted DNA targets. (A) Electrophoretic mobility shift assays were carried out for Bat1, 2 and 3 using 5’Cy5 labelled double-stranded DNA, bearing target sequences deduced from the TALE code. Each protein (100 nM) was tested against each target DNA (10 nM). Cy5 fluorescence was visualized after running through a native polyacrylamide gel. A shifted band, running slower on the gel, indicates the protein–DNA complex. (B) The interaction between Bat1 and its target (BEBat1) was quantified using microscale thermophoresis. The fluorescence ratio over the thermophoretic jump is shown on the y-axis against DNA concentration. Standard deviation for four repetitions is indicated. Measurements were made with 40% LED and 20% laser power. The dark grey line indicates the Kd fit. (C) This was repeated for BE Bat1 derivatives bearing A (grey bar), C (filled stripes) or G (spotted) at the zero position. The Kd was calculated in each case and is shown compared to that with BEBat1 (T0, empty bar).