
Figure 5.
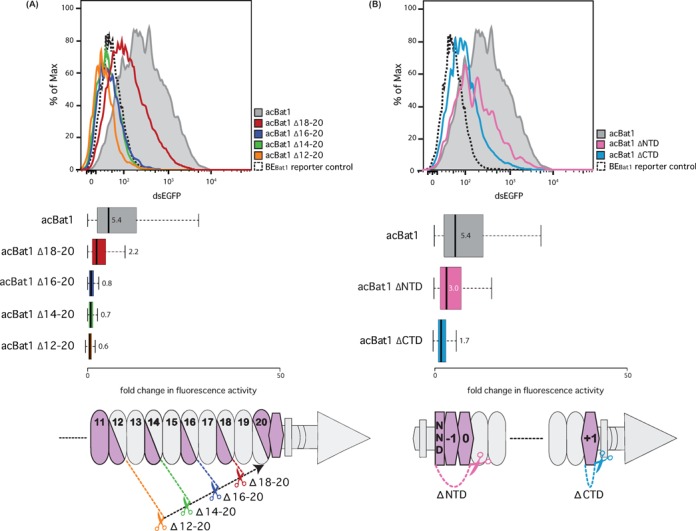
Functional analysis of acBat1 repeat truncations. Tests were carried out as described (Figure 3). Flow cytometry measurements of dsEGFP fluorescence are displayed as population distributions (top) or box plots (centre). Distinct colour codes are used throughout the whole figure and correspond to indicated constructs. Boxplots show fold changes in fluorescence intensity compared to the reporter control with whiskers representing the 2.5% and 97.5% data limits. Median values are written next to or inside each box plot and shown graphically as thick black lines. Cartoon representations of the tested truncations are shown below. Dashed lines with scissors indicate fixed (black) and variable (coloured) truncation points. Bat repeats and fused domains of acBat1 are represented as in Figure 3A. (A) Within the repeats grey or purple indicate truncated or retained regions, respectively. (B) N- (ΔNTD) or C- (ΔCTD) terminal truncations were tested. NND is the short non-repetitive N-terminal domain at the N-terminus of Bat1.