
Figure 6.
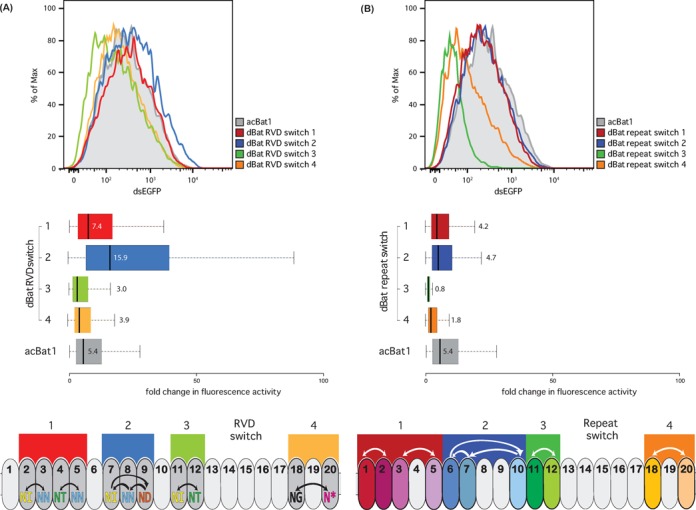
Functional analysis of designer (d)Bat constructs generated by RVD (A) or repeat switch (B). dBats were tested using flow cytometry with a transcriptional activation reporter as described (Figure 3). dsEGFP fluorescence values are displayed as population distributions (top) or boxplots (centre). dsEGFP values are normalized to the reporter only control (Supplementary Figure S13), which was BEBat1 for all constructs except RVD switch 1 and 2 (Supplementary Figure S6). Boxplots show fold changes in fluorescence intensity compared to the reporter control with whiskers representing the 2.5% and 97.5% data limits. Median values are written next to or inside each box plot and shown graphically as thick black lines. dBat design is outlined below in each case. Coloured boxes indicate the repeats (ovals) modified in a given dBat. In the case of the RVD switch (A) modified repeats are highlighted with darker grey. RVDs are shown and colour coded by type. Arrows indicate the rearrangement of RVDs between repeats. In the case of the repeat switch (B) repeats are coloured to indicate that each has a unique set of non-RVD residues. Arrows indicate movement of whole repeats within the array.