
Figure 5.
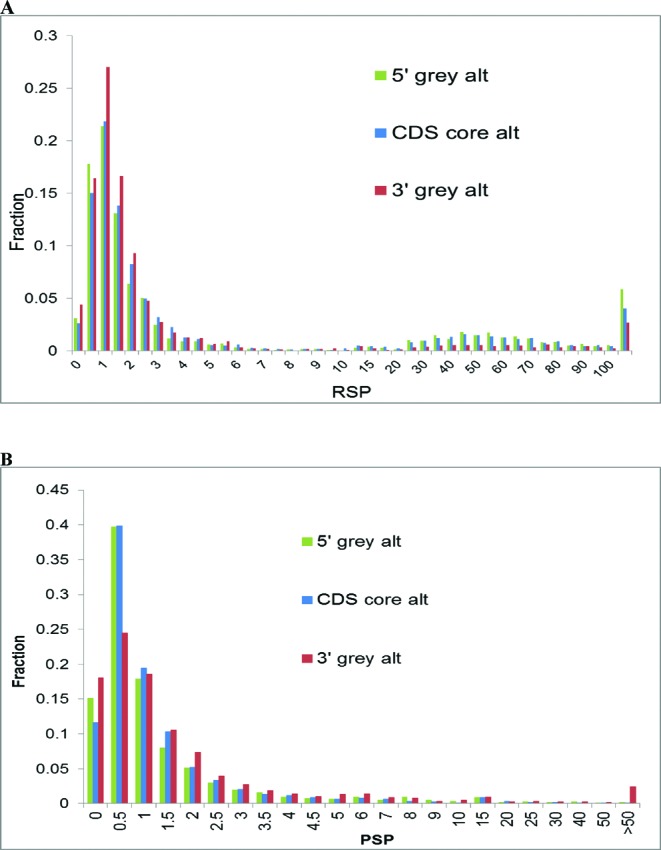
Distributions of RNA/nucleotide selection pressure ratio values, RNSP (A) and Protein Selection Pressure ratio values, PSP (B) in the 5′ grey area, cCDS and the 3′ grey area.
Official websites use .gov
A
.gov website belongs to an official
government organization in the United States.
Secure .gov websites use HTTPS
A lock (
) or https:// means you've safely
connected to the .gov website. Share sensitive
information only on official, secure websites.
Distributions of RNA/nucleotide selection pressure ratio values, RNSP (A) and Protein Selection Pressure ratio values, PSP (B) in the 5′ grey area, cCDS and the 3′ grey area.