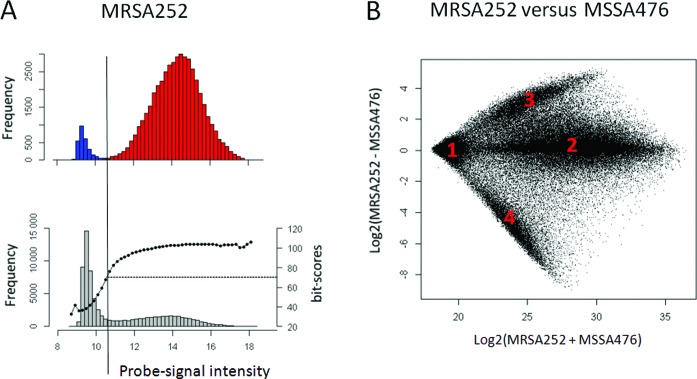
Figure 2.
Present/absence calling in S. aureus by means of probe-signal intensities of negative and positive controls. (A) Histogram showing the intensity distribution of negative-control probes (top panel, blue), perfect-match probes (top panel, red) and remaining probes on the microarray (bottom panel, grey) with the average bit-scores of each bin (dotted black line, bottom panel) for S. aureus strain MRSA252. (B) A ratio-intensity plot showing the log2 ratio against the log2 sum of the MRSA252 and MSSA476 probe intensity signals. The four groups, indicated in the graph, are discussed in the main text.

