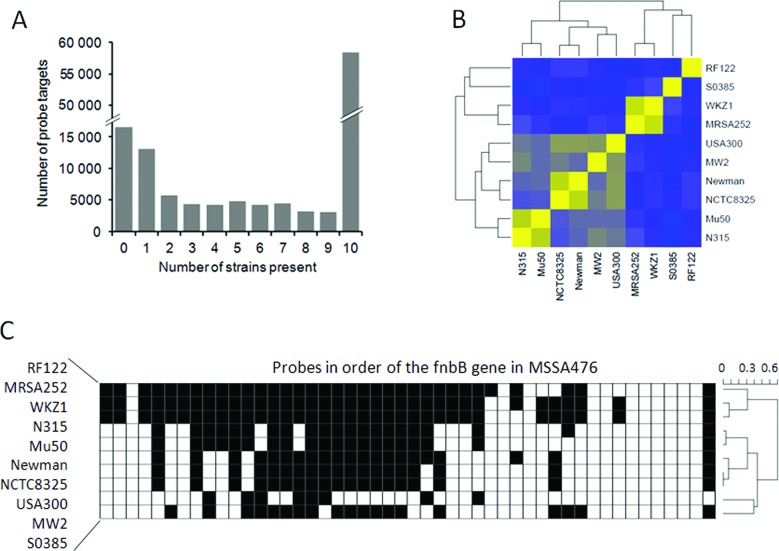
Figure 5.
Comparing 10 S. aureus strains by QAPC. (A) Histogram of the number of probe targets per number of strains in which a probe target was called present. (B) Binary similarity matrix, based on the probes that were called present in of one these 10 strains. Yellow indicates a high similarity of 1 and blue a low similarity. (C) Plot indicating whether probe targets were called present (white) or absent (black) in the gene encoding fibronectin binding protein B (fnbB) based on the annotation of MSSA476.

