
Figure 3.
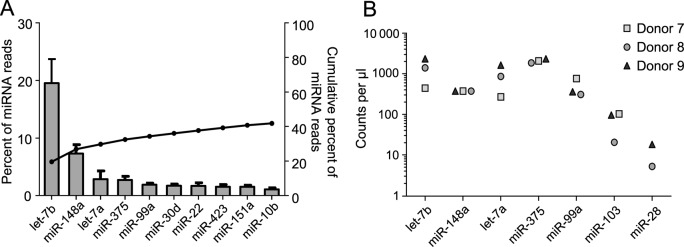
SE contain a few abundant miRNAs. (A) Top 15 most highly expressed unique miRNAs in SE. Left axis and bars: percent of total miRNA reads that mapped to each of the top 15 most abundant miRNAs. Error bars are standard deviation. Right axis and line: cumulative percent of total miRNA reads. (B) ddPCR analysis of miRNAs. RNA was isolated from three additional SE samples that had not been sequenced and assayed for miRNA levels by ddPCR assay. The five highest abundant (by sequencing) and two low abundance miRNAs were tested. Counts per μl of input cDNA are shown for each of the three donors. All reactions were run in triplicate with extremely low standard deviations (error bars always fell within each symbol and are not shown for better visual clarity). miR28 was analyzed in two donors only.