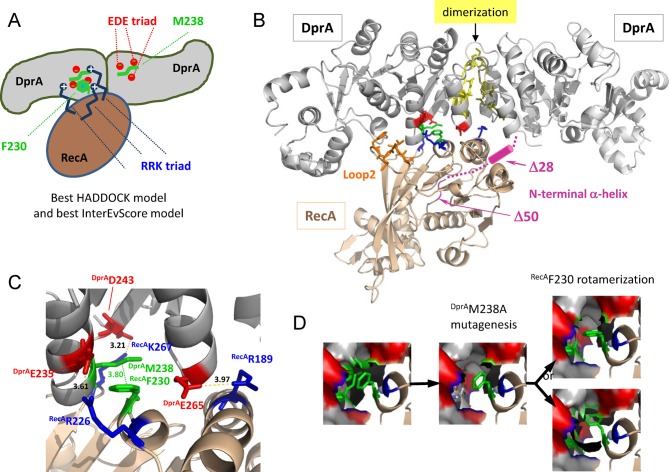
Figure 2.
Docking simulation results. (A) Schematic representation of the favored HADDOCK model from the docking runs (close to the best InterEvScore model). The central RecAF230, also involved in RecA multimerization, makes apolar contacts with a patch involving DprAM238. The DprAEDE triad is in contact with the RRK triad of RecA. (B) Best HADDOCK/InterEvScore model. Ribbon schematic representation of the DprA−RecA complex. The dimer of DprA is in gray and the monomer of RecA is in golden yellow. The residues highlighted in this work are shown in sticks and colored: DprAM238 and RecAF230 are in green, the EDE triad of DprA is in red, the RRK triad of RecA is in blue, the hydrophobic stretch of RecALoop2 is in orange; the N-terminal α-helix of RecA is in pink and probably points behind the DprA dimer. The dimerization zone of DprA is in yellow. (C) The DprA−RecA interaction zone is enlarged to show the residues (represented using the same color code as in (A)) involved in the interaction. Hydrogen bonds and salt bridges are represented by dashed lines, and distances between residues are indicated in Å. The main anchor in this interface is RecAF230, in apolar contact with DprAM238. (D) Possible molecular interpretation of the fact that the DprAM238A mutant displays reinforced interaction with Δ28RecA and Δ50RecA compared to WTDprA and loses interaction with F230ARecA. Upon DprAM238A mutation, a pocket would be created in the interface where the RecAF230 might relocate in a more favorable rotameric state.

