Figure 5.
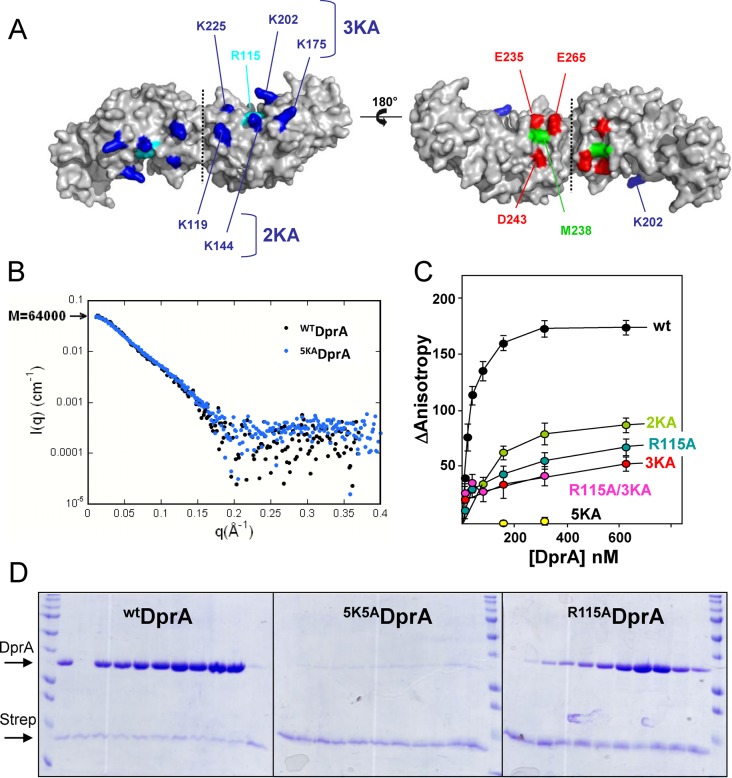
Localization of the DNA binding residues on DprA. (A) The electropositive (left) and electronegative (right) faces of the DprA dimer are represented. The five lysines mutated in five alanines to disrupt the interaction with ssDNA were colored in dark blue, and the conserved arginine 115 is in cyan. The acidic EDE triad is in red, and the central M238 is in green. (B) SAXS analysis indicates that 5KADprA is a dimer in solution, confirming its good folding. The experimental scattering curve I(q) of WTDprA (black dots; taken from (18)) was superimposed on the curve of 5KADprA (blue dots). (C) Equilibrium binding of WTDprA, R115ADprA, R115A/3KADprA, 2KADprA, 3KADprA and 5KADprA to fluorescein-labeled dT20. (D) In vitro binding assay between purified WTDprA, 5KADprA and R115ADprA according to increased concentration (20 to 640 pmol), and 80 pmol of 65-mer oligonucleotide bounded to streptavidine (Strep) (see Materials and Methods for details). Proteins are indicated on the left of the 14% SDS-PAGE gel stained by Coomassie-blue.

