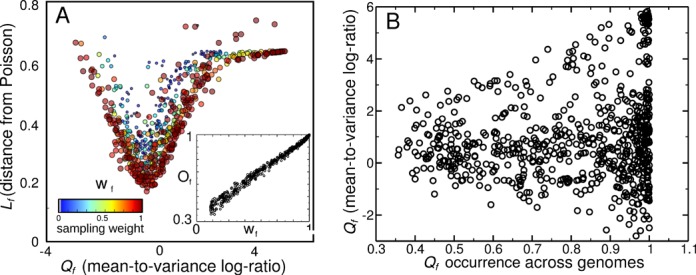
Figure 3.

Robustness of the abundance profile classification with respect to the sampling weight of families wf. (A) The scatter plot is the same as the one in Figure 2 of the main text, but color and size of each point correspond to the sampling weight wf. The ‘V’ shape of the relation between Lf and Qf is more marked for the families with high wf. Inset: linear relation between sampling weight wf and the occurrence Of of families. The latter is defined as the fraction of genomes having at least one domain of the family considered. The fact that high wf families are not preferentially associated with any value of Qf indicates that the classification operated by Qf is robust. (B) Lack of correlation between Of and Qf.
