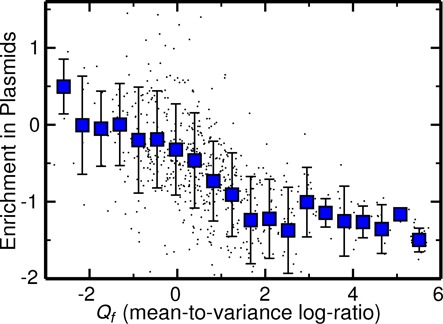
Figure 5.

Enrichment of dispersed families on mobile elements (plasmids). The abundances of domain superfamilies on plasmids were obtained from domain assignments of the NCBI plasmid sequence collection. The plot shows the correlation of Qf with enrichment of families on plasmids. The y-axis represents a log ratio score (21) between the percentage of total plasmid domains belonging to a given superfamily and the background percentage computed on all bacterial genomes. This score increases for families that are increasingly enriched on plasmids.
