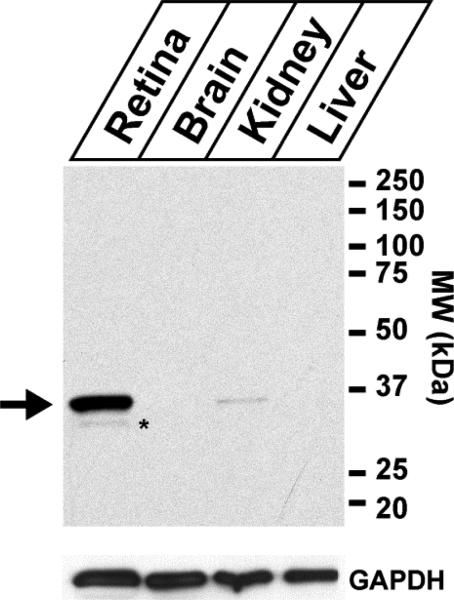
Figure 1. Analysis of the expression of syntaxin 3 protein in different tissues.
Top panel: Tissue extracts from retina, brain, kidney and liver where separated by SDS-PAGE and analyzed by western blotting using the syntaxin 3 antibody. The predicted position of syntaxin 3B (33kDa) is labeled with an arrow. A weak band that migrates slightly lower and probably represents a breakdown product is labeled with asterisk. The analysis shows that syntaxin 3 is highly expressed in retina and weakly expressed in the kidney. No expression of syntaxin 3 protein was detectable in brain or liver under these conditions. Bottom panel: The expression of the ubiquitously expressed marker Glyceraldehyde 3-phosphate dehydrogenase (GAPDH) was analyzed to confirm equal protein concentrations in the tissue extracts.

