. 2014 May 29;3:e02811. doi: 10.7554/eLife.02811

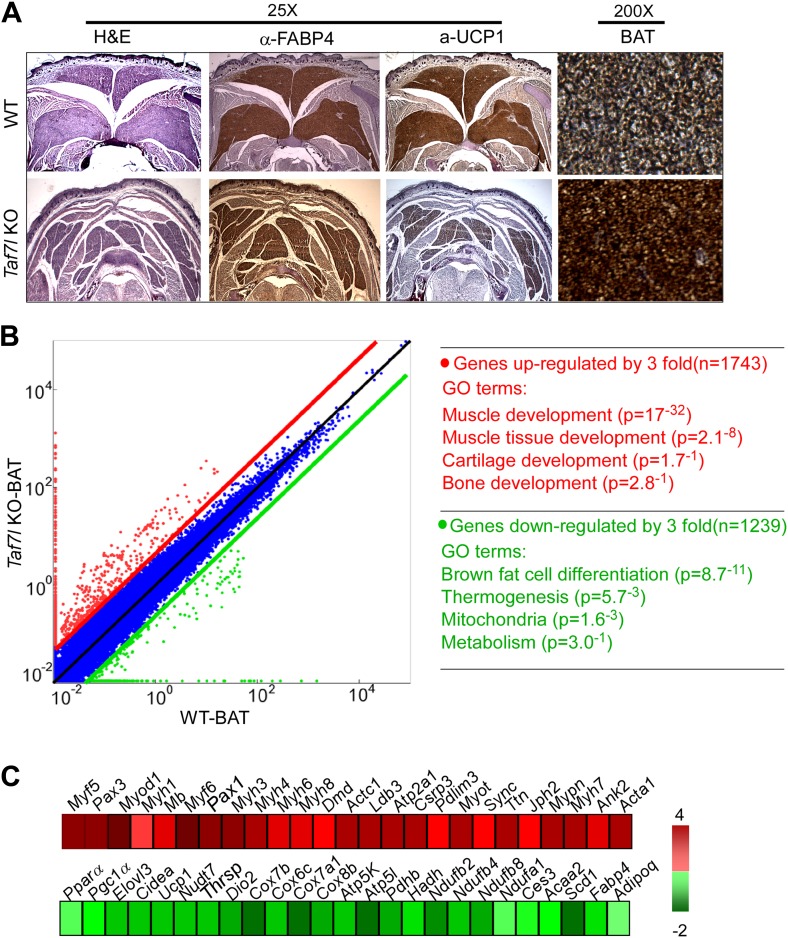
Figure 1. TAF7L is required for proper mouse brown adipose tissue (BAT) formation.

(A) Wild type (WT) and Taf7l knockout (Taf7l KO) interscapular BAT from E18.5 embryos was stained with haematoxylin and eosin (H&E), FABP4, and UCP1 (25X magnification shown). Rightmost panel shows FABP4 staining at 200X magnification. (B) Left panel: scatterplot shows gene expression profile in WT versus Taf7l KO BAT tissue; red dots represent genes up-regulated in Taf7l KO, green dots represent down-regulated genes in Taf7l KO. Right panel: gene ontology analysis shows functional groups of genes changed by at least threefold. (C) Difference in expression of either muscle-specific (top) or brown fat (bottom) genes between WT and Taf7l KO BAT with progressive red and green shades showing degrees of up- and down-regulation, respectively.

DOI: http://dx.doi.org/10.7554/eLife.02811.003

Figure 1.

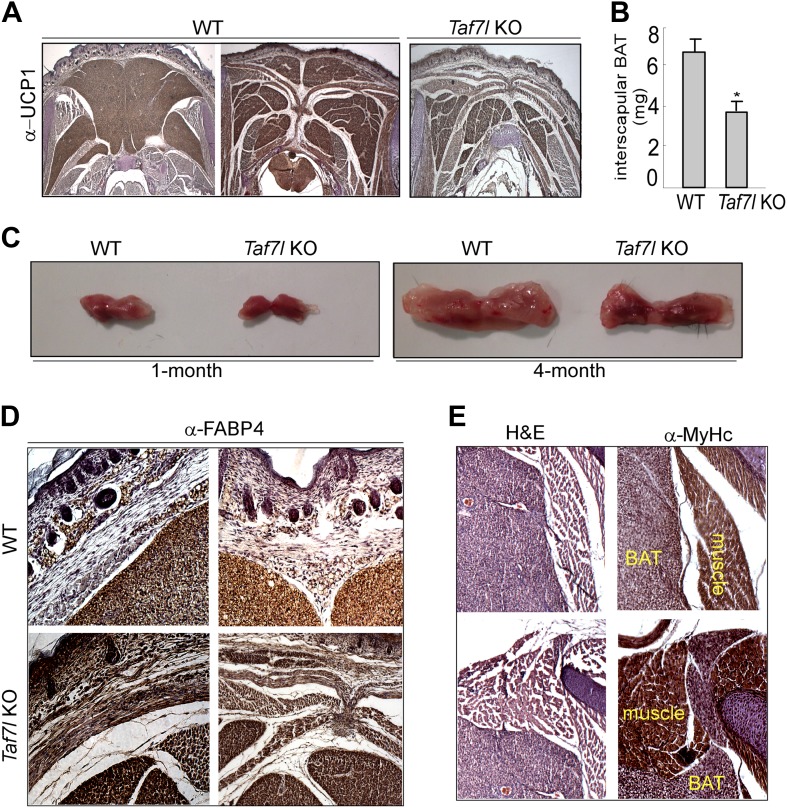
Figure 1—figure supplement 1. Depletion of TAF7L shifts BAT to muscle lineage.

Figure 1—figure supplement 1.

(A) UCP1-stained BAT samples as in Figure 1A for three additional animals (2WT and 1 TAF7L KO). (B) Average BAT weight from WT (n = 10) and Taf7l KO embryos (n = 9). (C) Photographs of whole BAT from 1- or 4-month-old WT and Taf7l KO mice. (D) High-magnification images (200X) of similar areas of WT and Taf7l KO embryonic BAT stained with FABP4 antibody. (E) Haematoxylin and eosin (H&E) and myosin heavy chain (MYHC) staining of Taf7l KO embryos shows muscle–tissue structures along the BAT at high magnification (200X).

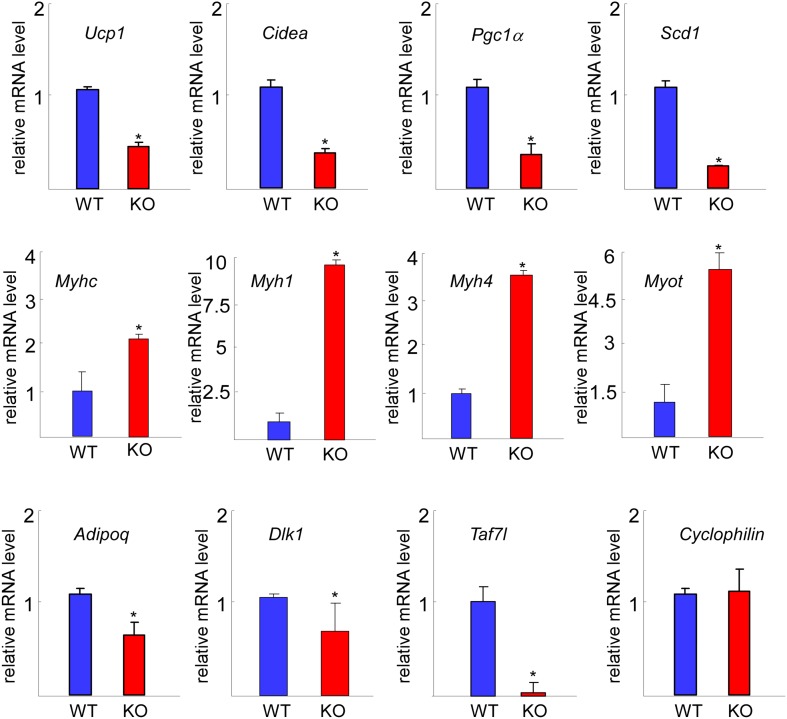
Figure 1—figure supplement 2. RT-qPCR comparison of gene expression in WT and Taf7l KO BAT.

Figure 1—figure supplement 2.

Expression levels of BAT-specific genes Ucp1, Cidea, Pgc1a, and Scd1, muscle-specific genes Myhc, Myh1, Myh4, and Myot. Common fat marker gene Adipoq, adipocyte progenitor marker Dlk1, Taf7l and Cyclophilin were used as control. mRNA levels in WT BAT was assigned to 1, and mRNA levels of each gene in Taf7l KO BAT was compared to WT BAT. RT-qPCR was normalized to the levels of Cyclophilin (L). *p<0.05, data is mean and SEM is from triplicates.