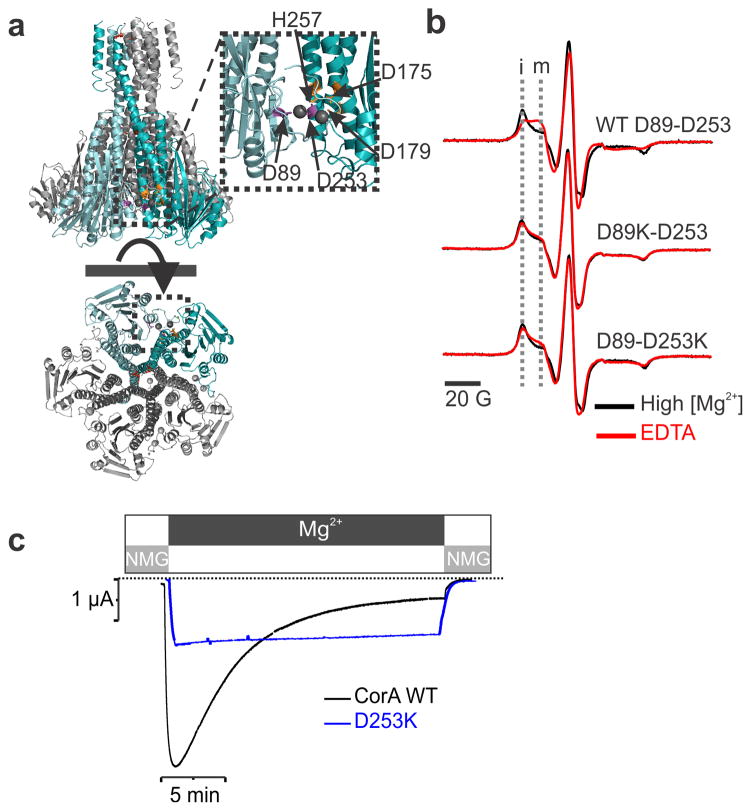
Figure 3. The divalent cation sensor.
a. Close up view of the putative regulatory Mg2+ binding domain revealed by the crystal structure. b. EPR spectra of the Q260C-spin labeled mutant recorded in presence of 20 mM Mg2+ shown in black and in absence of divalent cation shown in red. The experiments were repeated in the background of the WT protein, D89K and D253K mutation. The immobile (i) and mobile (m) components of the low field spectra are highlighted by two vertical dash line. c. Representative macroscopic current traces recorded for WT CorA and D253K are shown in black and blue respectively.

