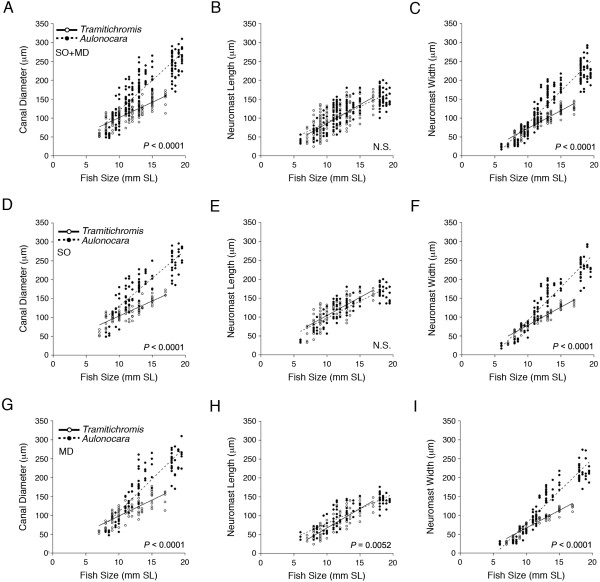
Figure 10.

Comparison of ontogenetic trends in canal diameter and neuromast size in SO and MD canals. A-C) Comparison of rates of increase in three variables: canal diameter (A), neuromast length (B) and neuromast width (C) for SO and MD canals combined, in Tramitichromis and Aulonocara. D-F) Comparison of rate of increase in canal diameter (D), neuromast length (E) and neuromast width (F) for the SO canal in both species. G-I) Comparison of rate of increase in canal diameter (G), neuromast length (H) and neuromast width (I) for the MD canal in both species. See Tables 1 and 2 for results of ANOVA and ANCOVA. Significance level = P <0.05; N.S. = no significant difference in rates of increase. MD, mandibular canal; SO, supraorbital canal.
