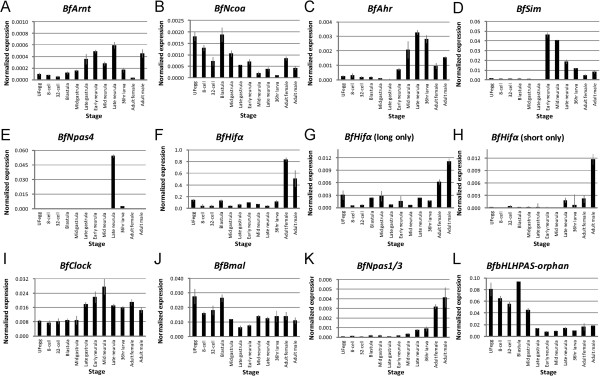
Figure 3.

Relative transcript levels of amphioxus bHLH-PAS genes at representative developmental stages. (A-L) Transcript levels of amphioxus bHLH-PAS genes, shown as percentages of those of 18S rRNA. Error bars show the standard deviation of technical replicates. Developmental stage of samples are: unfertilized egg (UFegg), 8-cell morula (8-cell), 32-cell morula (32-cell), Blastula, G3 (Mid gastrula), G5 (Late gastrula), N1 (Early neurula), N2 (Mid neurula), N3 (Late neurula), L2 (36 hr larva), adults (female and male). Because each quantitative PCR primer pair had unequal efficiency in amplification, the resultant relative expression level of different genes or primer pairs may not be directly compared to those of other primer pairs. For BfHifα, three primer sets with amplicons on exon 17 to 18 (F), exon 11 to 12 (G), and exon 10 to 12 without exon 11 (H) were used to show the total BfHifα expression level and those of different transcript isoforms.
