
Figure 1.
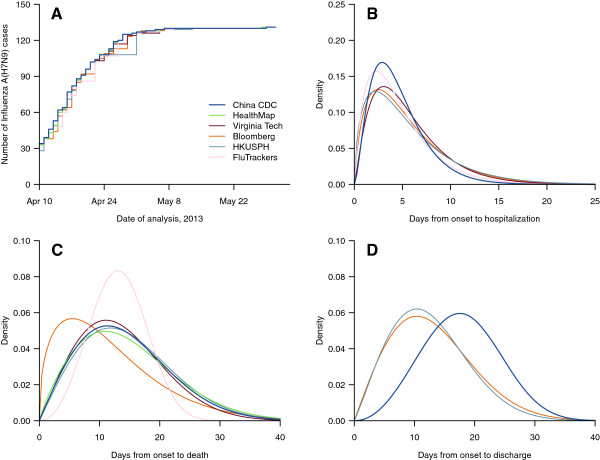
Epidemiological distributions based on analysis of line lists on 1 May 2013. (A) Number of laboratory-confirmed cases of influenza A(H7N9) virus infection, 10 April to 31 May, 2013. (B) onset-to-hospitalization distribution. (C) onset-to-death distribution. (D) onset-to-discharge distribution. Date of analysis refers to US local time for HealthMap, Virginia Tech and FluTrackers line lists, and China local time for China CDC, Bloomberg and HKUSPH line lists. China CDC, Chinese Center for Disease Control and Prevention; HKUSPH, the University of Hong Kong School of Public Health.