
Figure 3.
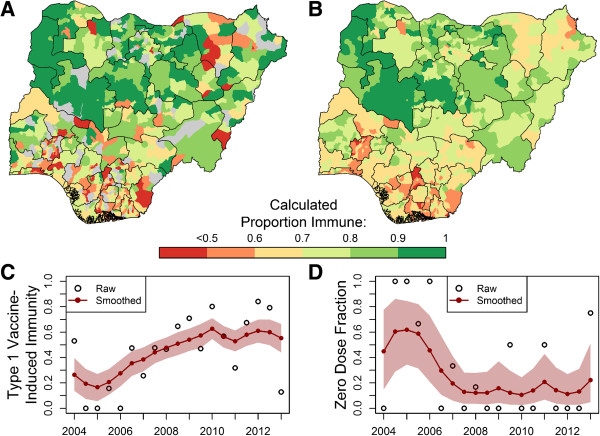
Impact of statistical smoothing model. (A), Map of district NP-AFP WPV1 vaccine-derived immunity, December 2012 through May 2013. Districts colored gray if no data NP-AFP cases reported in this interval. (B), Map of smoothed district WPV1 immunity estimates for the same period. See Discussion for explanation of the relatively low calculated immunity in southern districts. (C, D), Raw versus smoothed indicators over time in Maiduguri, Borno district for WPV1 immunity estimates (C) and zero-dose fraction (D). The shaded region represents the point-wise 95% posterior credible interval (CI) of parameter mean estimates.