
Figure 5.
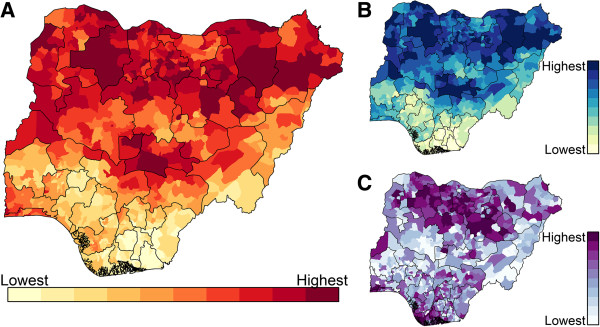
Model predictions from the selected model for June through November 2013. (A), The predicted risk, or expected number of cases, under the model. (B), The predicted probability of one or more reported cases, i.e., the output from the binomial portion of the hurdle model. (C), The predicted number of reported AFP cases given an introduction (one reported AFP case). All estimates based on covariates from December 2012 through May 2013.