
Figure 6.
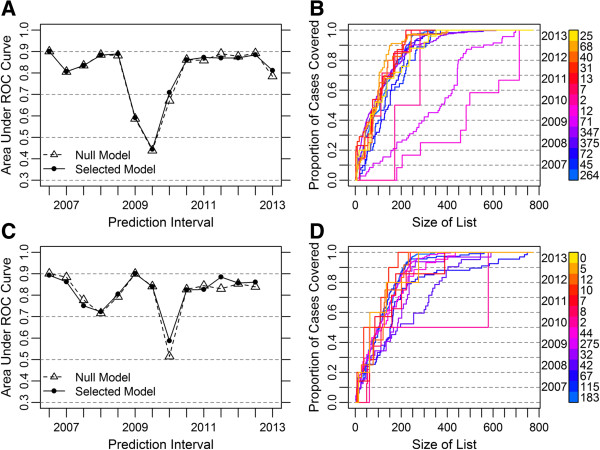
Forecasting accuracy of historical WPV1 and WPV3 models. (A, C), Area under the ROC curve for historical models by prediction interval for WPV1 (A) and WPV3 (C). The null model contains only random effects. The selected models include population and estimated population immunity in the Poisson portion and population immunity and recent caseload information in the binomial portion (Table 1 and Additional File 1: Table S2). (B, D), Case sensitivity curves for selected WPV1 (B) and WPV3 (D) model predictions. The color signifies the prediction interval. The number of cases in the given prediction interval is written to the right of the legend.