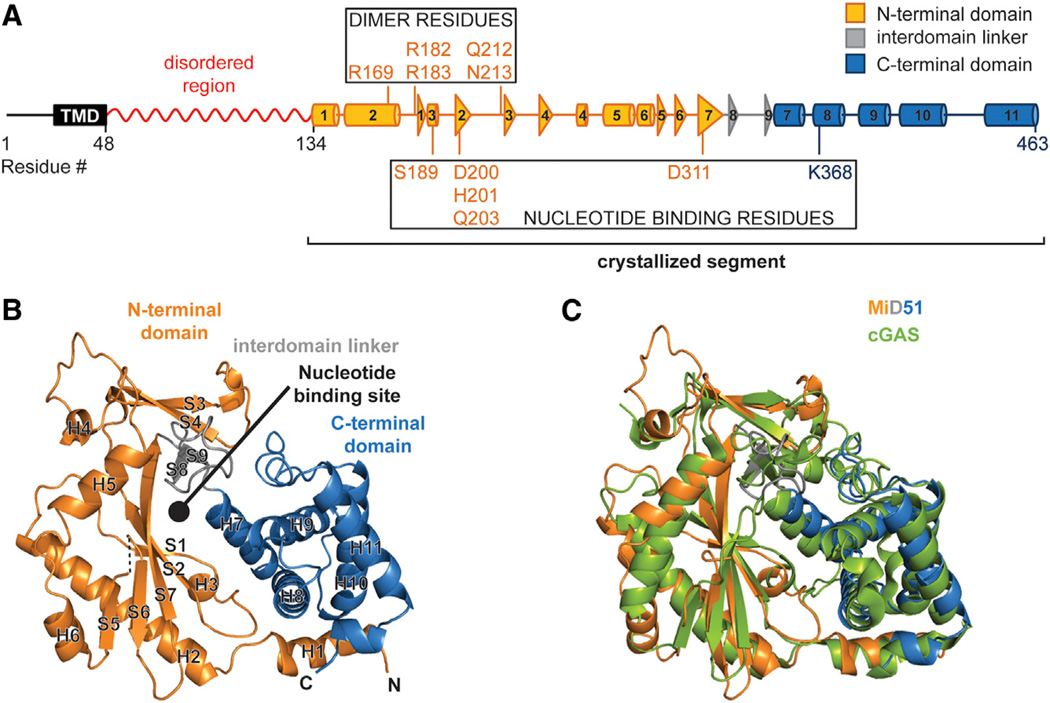
Figure 1. The Cytosolic Region of MiD51 Has a Nucleotidyl Transferase Domain.
(A) Schematic of MiD51. The region determined by X-ray crystallography is indicated and color-coded as in (B). The red squiggle indicates a region predicted to have low probability of regular secondary structure. Boxes highlight residues important for nucleotide binding and the dimer interface. TMD, transmembrane domain. Cylinders represent α-helical segments and triangles strand segments. α helices and β strands from the crystallized segment are numbered.
(B) Ribbon representation of mouse MiD51Δ1–133. Orange, N-terminal domain; gray, interdomain linker; blue, C-terminal domain. α helices and strands are numbered according to (A). Dashed lines denote residues missing from the model. N and C denote the N and C termini. The circle indicates the predicted nucleotide-binding pocket.
(C) Structural overlay of MiD51 (colored as in B)and cyclic GMP-AMP synthase (cGAS) (green).

