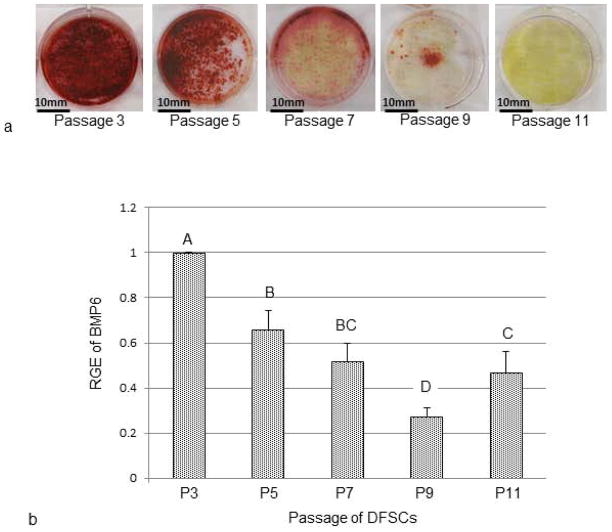
Fig. 3.
Evaluation of differentiation potential and BMP6 expression in different passages of DFSCs. (a) Osteogenic differentiation of different passages of DFSCs revealed the reduction of the osteogenic capability in later passages as shown by Alizarin Red staining of calcium deposits. (b) Expression of BMP6 in different passages of DFSCs during osteogenic differentiation indicated that DFSCs expressed significantly higher levels of BMP6 in the early passages than in late passages as determined by real-time RT-PCR. Statistical significances were denoted by letters (A, B, C and D) in the bar chart. Bars labeled with a same letter indicate no statistical difference of relative gene expression (RGE) at P≤0.05 (n=4).

