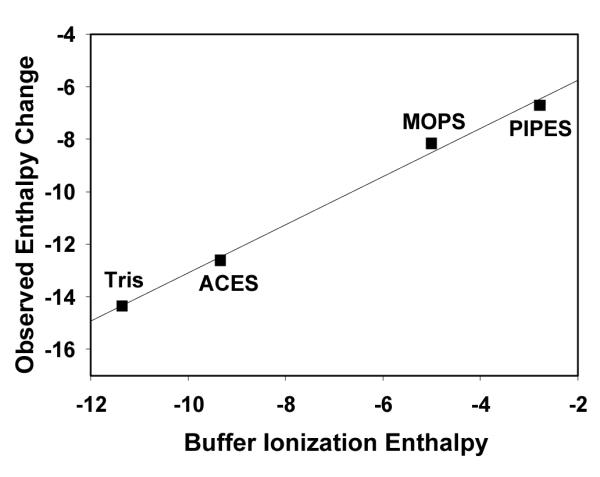
Figure 5.

Plot of the addition of observed enthalpy from ITC and metal-buffer interaction enthalpy (ΔHITC + ΔHZn-Buffer) versus buffer ionization enthalpies (ΔHH-Buffer) in various buffers at pH 7.4. Values for ΔHITC, ΔHZn-Buffer and ΔHH-Buffer in various buffers are listed in Table 1 and Table S1. Linear regression values: y = 0.92 × – 3.92. R2 = 0.99.
