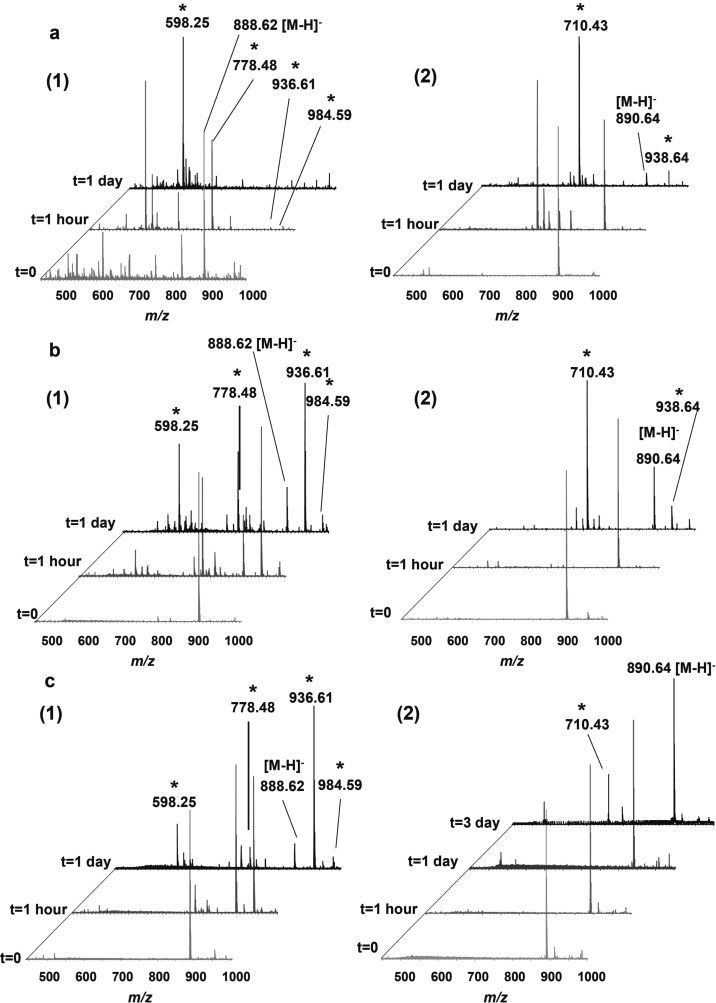
Figure 2.
Negative-ion mode ESI-MS spectra acquired following deposition of d18:1/C24:1 ST (1) and d18:1/C24:0 ST (2) onto different surfaces, silica gel TLC plate (a), aluminum foil (b), and glass slide (c), and exposure to ambient air for 0, 1 h, and 1 day prior to analysis. Oxidation products are labeled with an asterisk (*).

