
Figure 1.
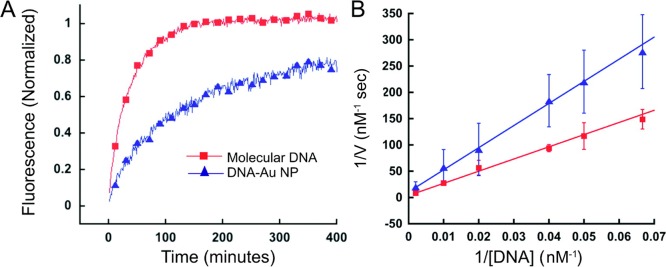
Comparison of the degradation rates of molecular DNA and DNA–AuNP systems. (A) Fluorescence-based progress curves of the enzyme-catalyzed reaction as a function of time. (B) Double reciprocal (Lineweaver–Burk) plot of the initial degradation velocity as a function of DNA-duplex concentration, which is used to calculate the kinetic parameters of the reaction. Reproduced with permission from ref (22). Copyright 2008 American Chemical Society.