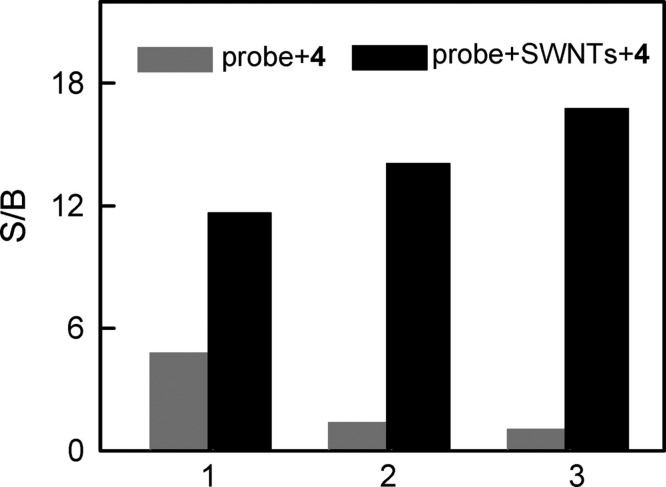
Figure 4.
Comparisons of the signal-to-background ratio (S/B) of the fluorescent oligonucleotides generated by their perfectly complementary target 4. Gray bar: S/B of 1–3 generated by 6-fold excess of 4 in the absence of SWNTs. Black bar: S/B of 1–3 generated by 6-fold excess of 4 in the presence of SWNTs. The concentrations of 1–3 were 50 nM. Excitation was at 480 nm, and emission was monitored at 520 nm. Reproduced with permission from ref (24). Copyright 2008 American Chemical Society.

