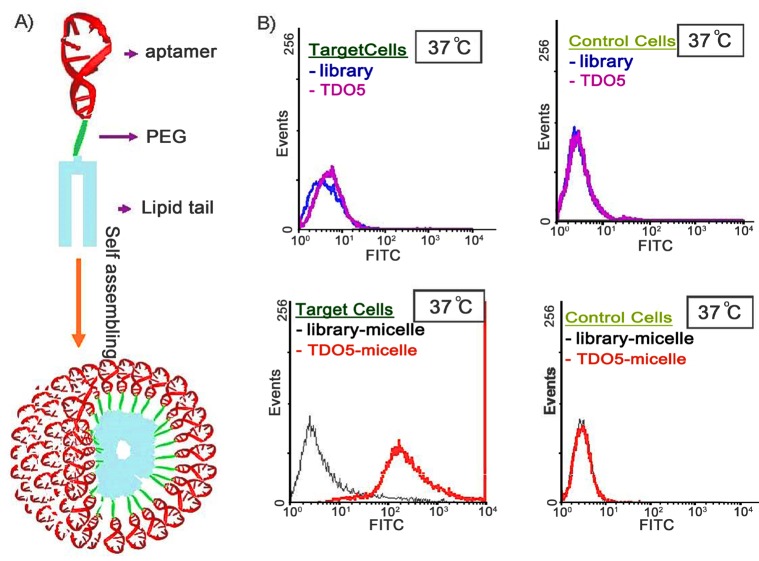
Figure 6.
(A) Schematic illustration of aptamer–micelle formation. (B) Flow cytometric assay to monitor the binding of free TDO5 (250 nM) with Ramos cells (target cells) and HL60 (control cells) at 37 °C for 5 min. The blue and black curves represent the background binding of unselected DNA library or library–micelle. The purple and red curves represent the binding of TDO5 or TDO5–micelle. Reproduced with permission from ref (28). Copyright 2010 National Academy of Sciences.

