
Figure 5.
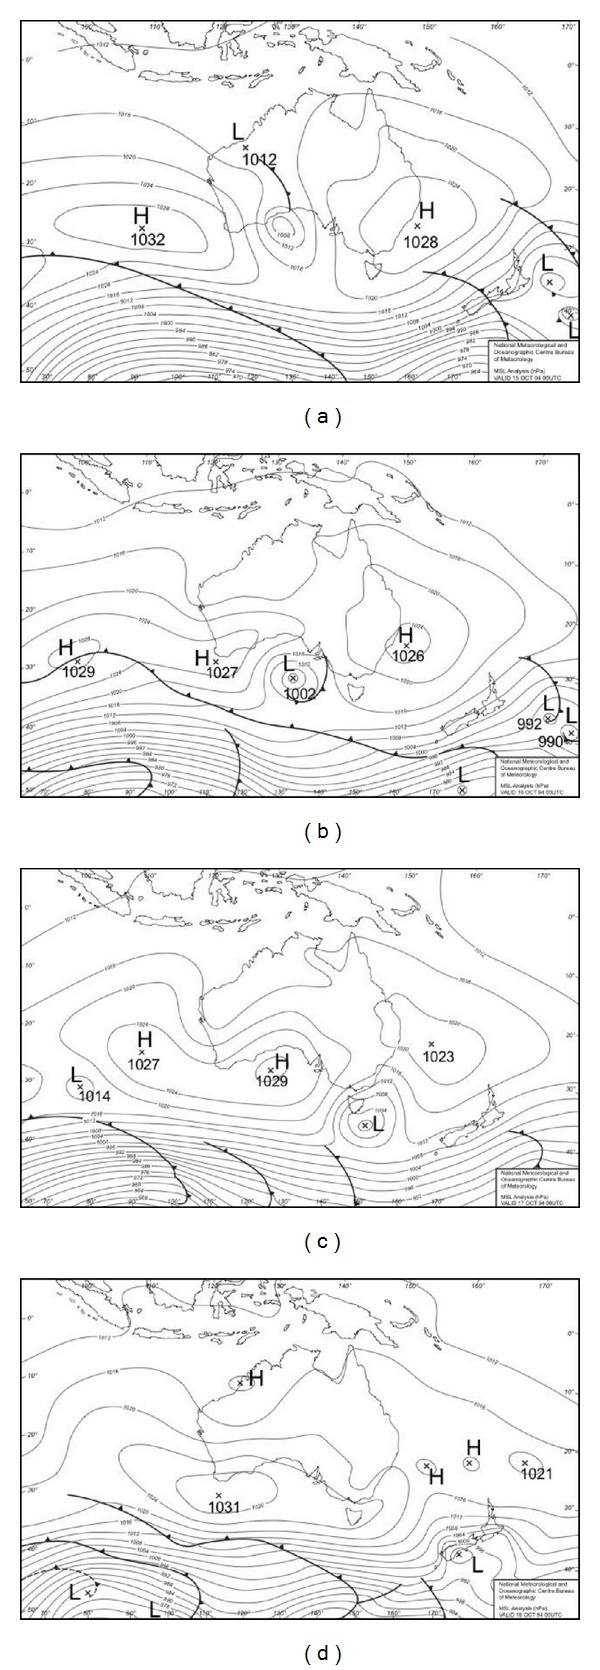
Synoptic charts showing mean sea level pressure (MSLP) analyses for the Australian region for the period 15–18 October 1994 (a–d respectively). The locations of high and low pressure and frontal systems are shown on the charts. Data are from the Australian Bureau of Meteorology.