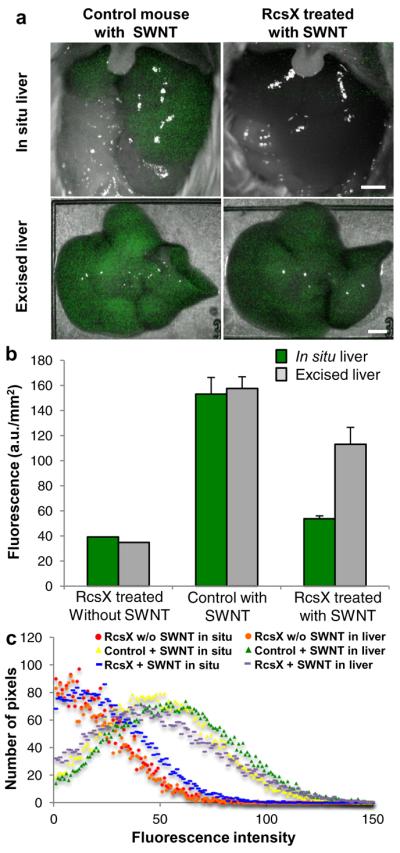
Figure 4. In vivo sensor quenching due to inflammation.

a, Inflamed (RcsX treated) and control (healthy) mice imaged in situ 30 minutes after tail vein injection of PEG-(AAAT)7-SWNT (200 μL injection of 50 mg L−1 SWNT) with their livers exposed then the excised liver imaged immediately following sacrifice, displaying the SWNT quenching that is observed in the inflamed animal (scale bars 4 mm). b, Chart showing quantification of SWNT fluorescence, including an extra control of a RcsX treated (inflamed) mouse that received a tail vein injection of saline. (n = 10, error bars are s.e.m.) c, Graph of SWNT fluorescence distribution in mouse livers shown in a and b.
