Abstract
Objective:
To compare Dixon-based MRI techniques for intramuscular fat quantification at 3 T with MR spectroscopy (MRS) in vitro and in vivo.
Methods:
In vitro, two- three- and four-point mDixon (Philips Medical Systems, Best, Netherlands) sequences with 10°, 20° and 30° flip angles were acquired from seven test phantoms with sunflower oil–water percentages of 0–60% sunflower oil and calculated fat–water ratios compared with MRS. In vivo, two- three- and four-point mDixon sequences with 10° flip angle were acquired and compared with MRS in the vastus medialis of nine healthy volunteers (aged 30.6 ± 5.3 years; body mass index 22.2 ± 2.6).
Results:
In vitro, all mDixon sequences correlated significantly with MRS (r > 0.97, p < 0.002). The measured phantom percentage fat depended significantly on the flip angle (p ≤ 0.001) and mDixon sequence (p = 0.005). Flip angle was the dominant factor influencing agreement with MRS. Increasing the flip angle significantly increased the overestimation of the mDixon sequences compared with MRS. In vivo, a significant difference was observed between sequences (p < 0.001), with all mDixon sequences overestimating the intramuscular fat content of the vastus medialis muscle compared with MRS. Two-point mDixon agreed best with MRS and had comparable variability with the other mDixon sequences.
Conclusion:
This study demonstrates that mDixon techniques have good linearity and low variability for use in intramuscular fat quantification. To avoid significant fat overestimation with short repetition time, a low flip angle should be used to reduce T1 effects.
Advances in knowledge:
This is the first study investigating the optimal mDixon parameters for intramuscular fat quantification compared with MRS in vivo and in vitro.
Chronic diseases associated with obesity are strongly related to the amount of adipose tissue in and around skeletal muscle tissue.1,2 Furthermore, many pathology exists, including cerebral palsy, where the patients exhibit reduced fat-free mass3,4 but have increased fat infiltration into skeletal muscle.5 Therefore, an effective method for quantification of intramuscular fat is required to determine which patients may develop obesity-related chronic diseases.
In the literature,6–9 fat–water fraction measurements are predominantly obtained using localized proton (1-H) MR spectroscopy (MRS). However, MRS has a limited spatial resolution compared with imaging techniques. Consequently, MRI techniques for the measurement of fat–water ratios are desirable, particularly in spatially heterogeneous tissue. Chemical shift imaging methods established on the Dixon technique10 that discriminate between fat and water spins based on their different resonance frequencies are now available on the majority of clinical MRI systems and are increasingly applied in clinical settings (mDixon, Philips Medical Systems, Best, Netherlands; Dixon, Siemens Healthcare, Erlangen, Germany; FatSep, Hitachi, Tokyo, Japan; and IDEAL, GE Healthcare, Waukesha, MI).
The original two-point Dixon (2PD) technique10 acquired two images using a modified spin-echo pulse sequence. One image is a conventional spin-echo image with water and fat in phase, the second is acquired with the read out gradient shifted to produce an image with 180° water–fat phase difference. These images then undergo complex addition or subtraction to produce water only and fat only images, respectively, from which a fat–water ratio image can be calculated. Therefore, a fat–water fraction measurement can be made for a much larger region of interest and with much higher spatial resolution using Dixon techniques than MRS. The three-point Dixon (3PD) technique11 was developed to reduce sensitivity to magnetic field inhomogeneities and, therefore, phase errors associated with 2PD12 by utilizing a combination of multipoint acquisition and image processing techniques. A four-point Dixon (4PD) technique has also been developed,13 in which the extra acquisition enables a more accurate correction of the phase error. Recent advancements in image processing techniques, such as iterative decomposition of water and fat with echo asymmetry and least-squares approach (IDEAL)14,15 have further helped to separate fat and water signals in inhomogeneous magnetic field regions.
Dixon imaging techniques have been widely used in the literature16–23 for hepatic fat quantification hepatic steatosis (for a review see Reeder and Sirlin16) and are increasingly utilized for intramuscular fat quantification. However, limited validation studies comparing Dixon and MRS techniques for intramuscular fat quantification have been reported.24 The purpose of this study was to perform such a validation at 3.0 T, as well as investigating optimal strategies by comparing two-, three- and four-point mDixon each with a range of flip angles.
METHODS AND MATERIALS
All MR data were acquired on a 3.0 T Achieva® system (Philips Medical Systems) running software v. 2.6.3, using an eight-channel receive-only phased array knee coil.
In vitro
Seven 50-ml test phantoms were produced consisting of 0%, 10%, 20%, 30%, 40%, 50% and 60%, respectively, sunflower oil mixed with water, to cover the range of intramuscular percentage fat observed in vivo.19 These phantoms were made following a method described previously,25 where 15 mmol of an anionic surfactant sodium dodecyl sulphate was added to 0.5 l of deionized water and 2.5 g of gelatine dissolved in the solution using a magnetic stirrer hotplate heated to 50 °C. The solution was poured into seven 50-ml plastic tubes along with the corresponding amount of sunflower oil, homogenized and placed on a roller overnight to set at room temperature (21 °C). All seven phantoms were placed within the knee coil to enable images of each phantom to be made within a single axial image acquisition. The scanner room temperature was set to 21 °C during image acquisition.
Localized MRS data were acquired of a voxel 40 × 40 × 5 mm at the centre of each phantom using a Point RESolved Spectroscopy (PRESS) sequence with echo time (TE)/repetition time (TR) = 35/5000 ms, 16 signals averaged (NSA), and with and without water suppression. Four axial gradient-echo mDixon imaging strategies were employed (see below) with three different flip angles (10°, 20° and 30°), slice thickness = 5 mm, 480 × 480 matrix size, 0.94 × 0.94 mm in plane resolution and 2 NSA.
two-point mDixon with water and fat signal phase sampling strategy (0, 180°); TE/TR = 2.3/5.0 ms, echo time shift (∆TE) = 1.14 ms
three-point mDixon optimized for phase estimation (3PDP) with (0, α, 2α) sampling strategy, where α = 120°,11 TE/TR = 2.11/5.2 and ∆TE = 0.76 ms
three-point mDixon optimized for magnitude estimation (3PDM) with (−α, 0, α) sampling strategy, where α = 180°,11,26,27 TE/TR = 2.3/5.4 ms and ∆TE = 0.76 ms
four-point mDixon with phase sampling strategy (0, α, 2α, 3α), where α = 90°, TE/TR = 2.3/5.6 ms and ∆TE = 0.57 ms.
Seven repeated acquisitions were acquired using each mDixon technique to assess reproducibility. Between each repeated scan, the phantoms were removed from the scanner and repositioned. To enable T2 correction to be applied to the MRS data, the T2 of the lipid and water in the 60% sunflower oil phantom was measured using stimulated echo acquisition mode MRS, TR = 10,000 ms, voxel size = 30 × 8 × 8 mm, NSA = 16 and TE = 40, 45, 50, 55, 60, 65, 70, 80, 90, 100 and 120 ms.
Data analysis
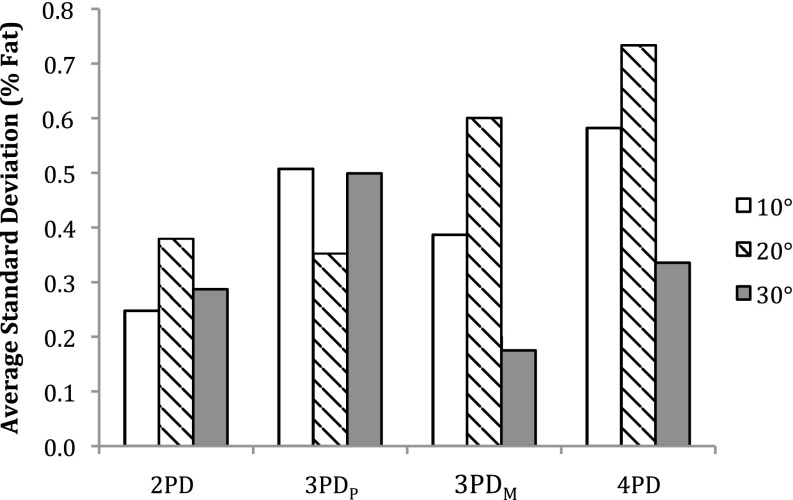
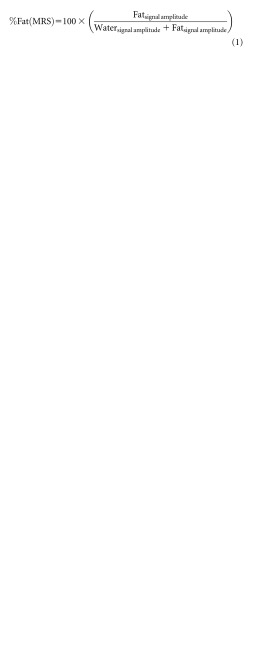
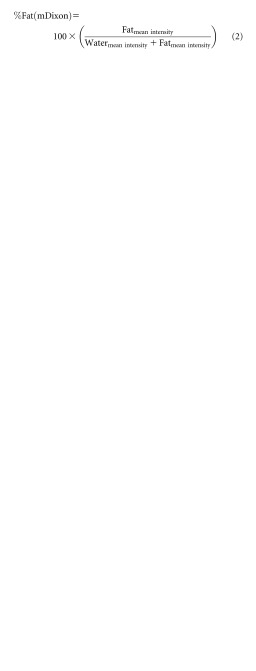
All MRS data were processed using the AMARES algorithm28 in magnetic resonance user interface java version (jMRUI).29 The percentage fat was measured according to Equation (1), with the lipid signal defined as the peak at 1.3 parts per million (ppm). The T2 values of the 60% sunflower oil phantom were calculated by fitting an exponential to the water and lipid amplitudes over increasing TE. The fitted lipid and water peaks were T2 corrected using T2 values measured in the 60% sunflower oil phantom. All mDixon images were processed on the scanner using the manufacturers in-built mDixon algorithm that calculates four image series: water signal, fat signal, in-phase and out-of-phase images. Volumes of interest (VOIs) were drawn over the volume of the phantoms filled by the water–fat emulsions using OsiriX (Pixmeo, Geneva, Switzerland).30 From these VOIs, the mean signal intensities from the fat and water images were measured to create a mDixon-based fat percentage [Equation (2)], and averaged across the seven repeated acquisitions. The mean percentage fat measured for each phantom using each technique was assessed for linearity using Pearson's correlations, and the route mean square (RMS) difference and Bland–Altman plots were calculated to assess the agreement with MRS. The RMS difference was not normally distributed (Kolmogorov–Smirnov test, p = 0.023), therefore, related-samples Friedman's two-way analysis of variance (ANOVA) by ranks test was employed to test for significant differences in agreement with MRS between the four mDixon sequences tested and by flip angle. The reproducibility of the sequences was defined as the standard deviation of the measured percentage during each repeated acquisition averaged across all phantoms.
 |
 |
In vivo
Nine healthy adult volunteers (five males; mean age, 30.6 ± 5.3 years; body mass index, 22.2 ± 2.6 kg m2) took part in the study. All volunteer scanning was approved by local research ethics committee (study number 01/11/12). Localized MRS data were acquired of the vastus medialis, PRESS, TE/TR = 35/2000 ms, 15 × 20 × 25 mm voxel and 32 NSA. mDixon images were also acquired with the same imaging parameters as in vitro with 10° flip angle and 10 NSA. Data acquisition times were 2:36, 4:03, 4:11 and 4:18 min for the 2PD, 3PDP, 3PDM and 4PD sequences, respectively.
Data analysis
All MRS data were processed using the AMARES algorithm28 in jMRUI.29 Water, intramyocellular (IMCL) and extramyocellular (EMCL) lipid peaks were quantified (with prior knowledge of peaks at 1.3 and 1.2 ppm, after removal of the residual water) and percentage fat calculated using Equation (1). The measured water, EMCL and IMCL signals were T2 corrected using T2 values for water (31.3 ms), EMCL fat (77.6 ms) and IMCL fat (89.4 ms) previously measured at 3 T in muscle.31
All mDixon images were analysed using OsiriX.30 VOIs were drawn to match the corresponding MRS voxel locations for fat and water, with the fat voxel shifted in the x, y and z directions calculated using a 3.4 ppm chemical shift between water and lipid at 3.0 T. From these VOIs, the mean signal intensities from the fat and water images were measured to create an mDixon-based fat–water ratio [Equation (2)]. The percentage fat measured by MRS and mDixon were compared for agreement using Bland–Altman plots,32 one-way ANOVA and Tukey post hoc test. All statistical analyses were performed using SPSS® v. 20.0 (SPSS, Chicago, IL).
RESULTS
In vitro
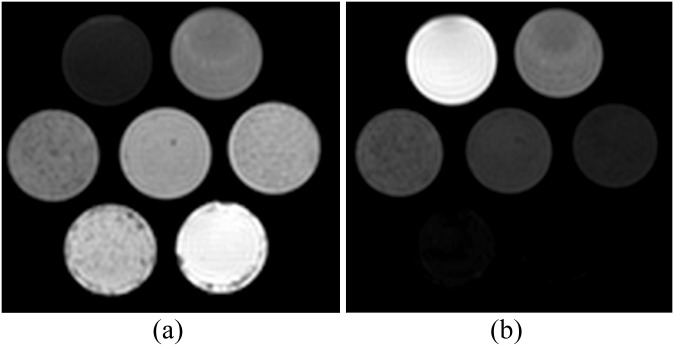
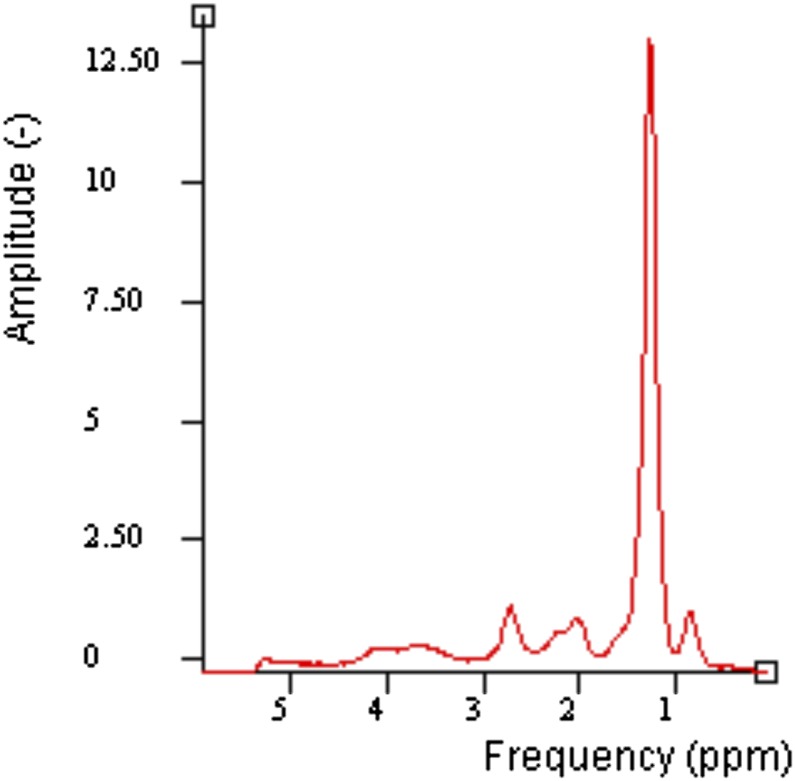
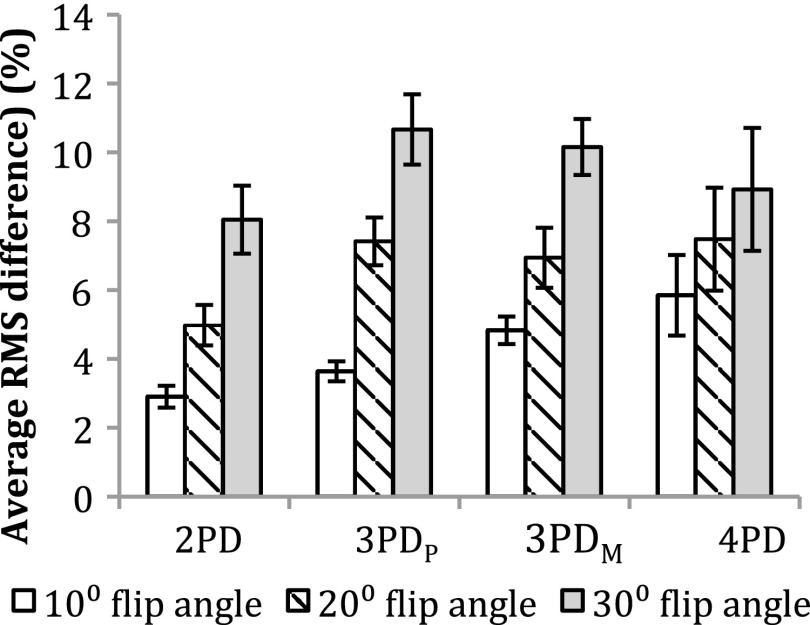
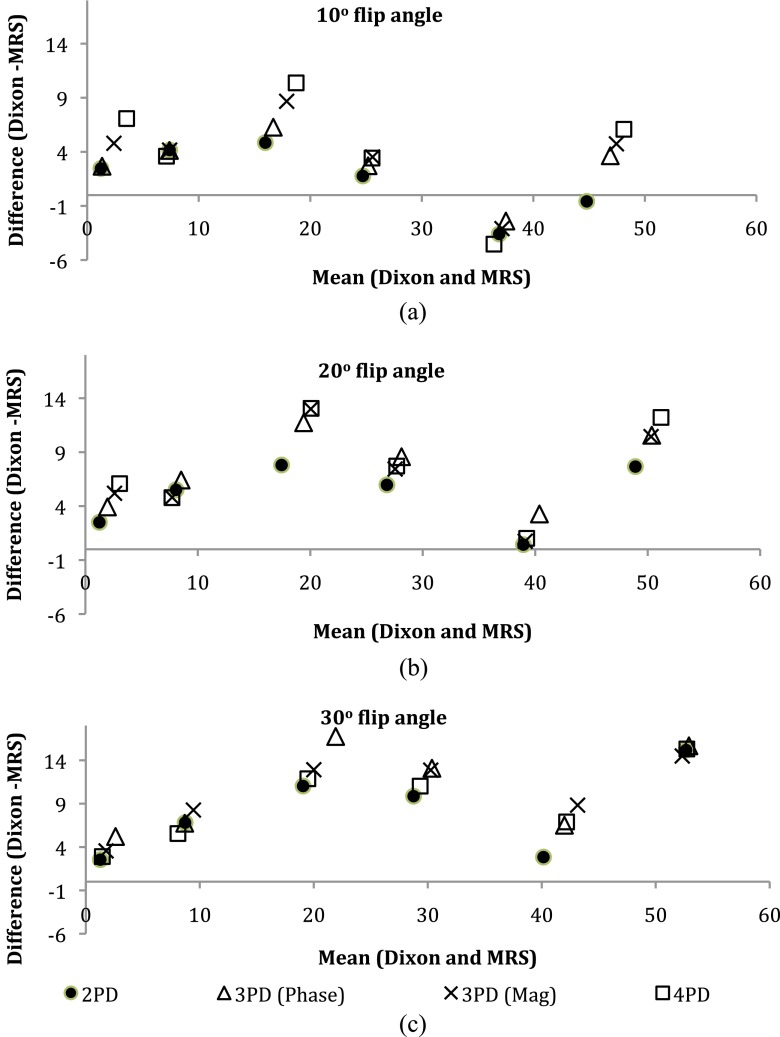
Figure 1a,b shows an example of water and fat images of the phantoms, respectively. An example in vitro spectrum with water suppression is shown in Figure 2. There were strong positive and significant correlations between MRS-derived and Dixon-based percentage fat measurement ratios for all Dixon sequences and flip angles (r > 0.97, p < 0.002). Figure 3 shows the average RMS difference between MRS and mDixon calculated phantom percentage fat by each technique and flip angle. A significant difference in the RMS difference was observed between flip angles (p ≤ 0.001) and between mDixon sequences (p = 0.005). Compared with MRS, all four mDixon sequences exhibited greater average RMS difference with larger flip angles. Bland–Altman plots comparing Dixon- and MRS-based measures of percentage fat are shown in Figure 4. As the flip angle of the mDixon sequences is increased, mDixon increasingly overestimates the fat content of the phantoms for all sequences investigated. Figure 5 summarizes the mean, standard deviation and reproducibility (average standard deviation) for each phantom and mDixon technique investigated.
Figure 1.
Examples of mDixon (a) water and (b) fat images of the phantoms acquired with two-point Dixon with 10° flip angle.
Figure 2.
An example of in vitro MR spectroscopy spectrum of 40% sunflower oil phantom with water suppression. ppm, parts per million.
Figure 3.
Average route mean square (RMS) difference between MR spectroscopy and mDixon measurements of phantom percentage fat. Error bars represent the standard error of the RMS difference. PD, point Dixon; PDM, mDixon optimized for magnitude estimation; PDP, mDixon optimized for phase estimation.
Figure 4.
Bland–Altman plots of agreement between MR spectroscopy (MRS) and mDixon sequences with (a) 10° flip angle; (b) 20° flip angle; and (c) 30° flip angle. Mag, magnitude; PD, point Dixon.
Figure 5.
Reproducibility represented by percentage fat standard deviation over seven separate acquisitions averaged across phantoms. PD, point Dixon; PDM, mDixon optimized for magnitude estimation; PDP, mDixon optimized for phase estimation.
In vivo
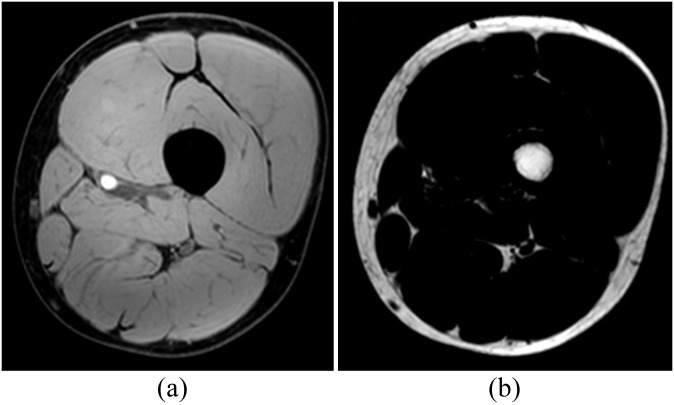
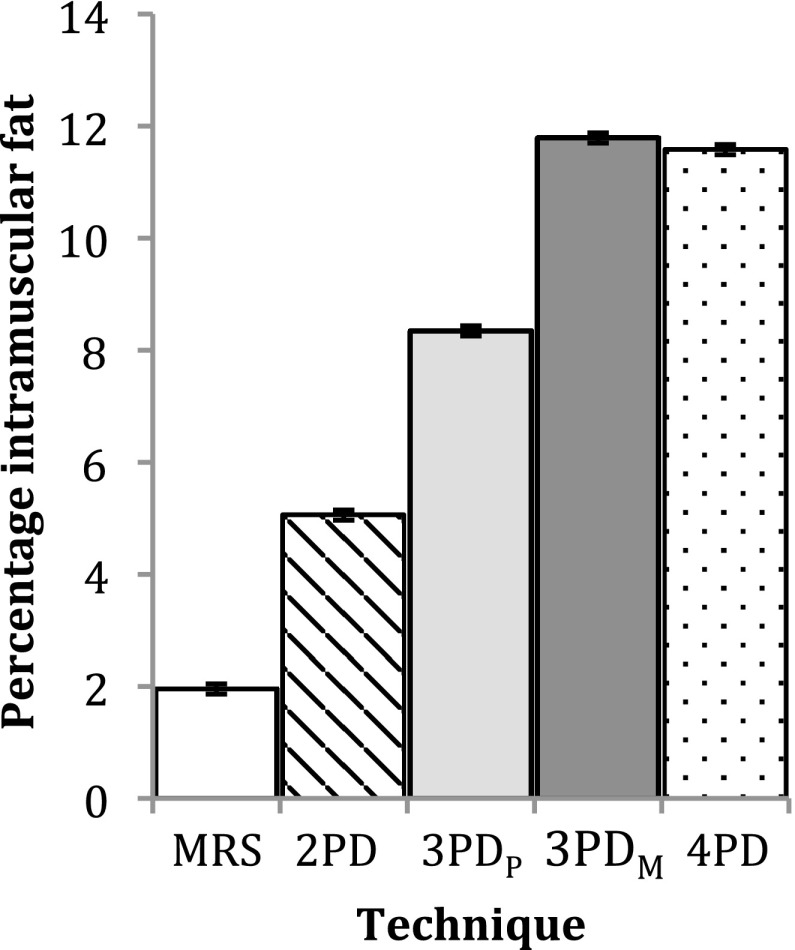
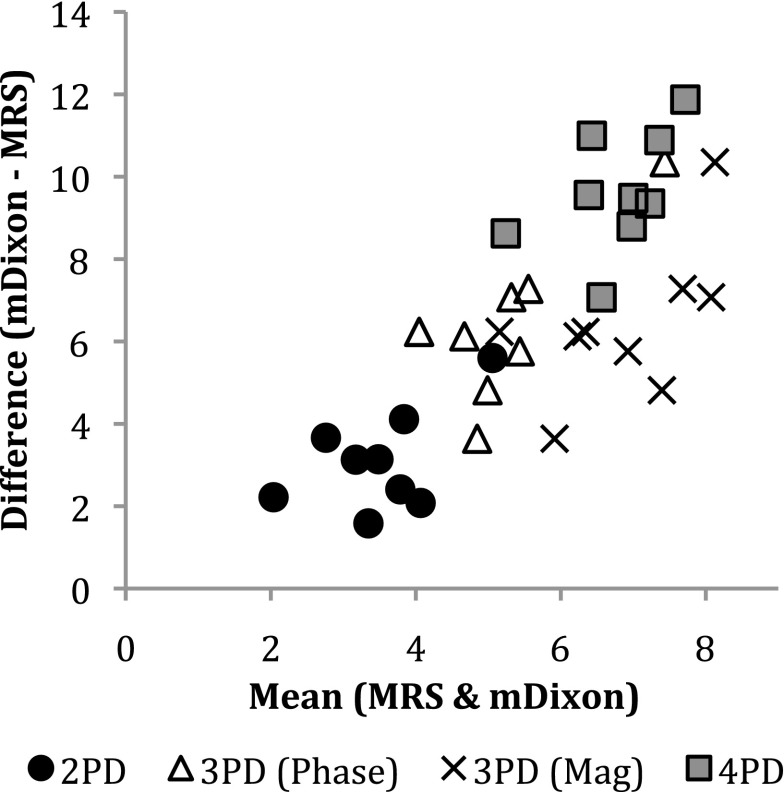
Figure 6 shows example water and fat images of one volunteer. Figure 7 shows an example MRS spectrum of one volunteer and the fitted IMCL and EMCL peaks. Figure 8 shows a histogram of the group mean percentage intramuscular fat measured by all techniques investigated. A significant difference was observed between the measurement techniques (ANOVA, p < 0.001). The Tukey post-hoc tests found a significant difference between all measurements (p ≤ 0.001) with the exception of 4PD and 3PDM (p = 0.998). In the Bland–Altman plot in Figure 9, comparing each mDixon technique investigated with MRS, it can be seen that all mDixon techniques overestimated the percentage intramuscular fat in the vastus medialis compared with MRS. 2PD exhibited the closest agreement with MRS and 4PD the worst agreement with MRS.
Figure 6.
Examples of (a) water and (b) fat images of the same volunteer acquired with two-point Dixon (2PD) sequence. This subject had 3.15% fat measured by 2PD.
Figure 7.
Example of (a) MR spectroscopy (MRS) spectrum of the vastus medialis from the same volunteer in Figure 5. This volunteer had 0.93% intramuscular fat measured by MRS. (b) Estimated intramyocellular (IMCL) and extramyocellular (EMCL) peaks. (c) Residual spectrum after fitting of IMCL and EMCL peaks. ppm, parts per million.
Figure 8.
Group mean intramuscular percentage fat in vastus medialis. Error bars represent the standard error of the group. MRS, MR spectroscopy; PD, point Dixon; PDM, mDixon optimized for magnitude estimation; PDP, mDixon optimized for phase estimation.
Figure 9.
Bland–Altman plot showing the agreement between intramuscular percentage fat measured using MR spectroscopy (MRS) and the four mDixon sequences tested in vivo. Mag, magnitude; PD, point Dixon.
DISCUSSION
In vitro, all mDixon techniques correlated very strongly with the MRS measured percentage fat (r > 0.97, p < 0.002). As shown in Figures 3 and 4, increasing the flip angle significantly overestimated the measured percentage fat using all mDixon techniques investigated compared with MRS, and this was found to have a much larger effect on the agreement between the Dixon and MRS than Dixon sequence type (2PD, 3PDP, 3PDM or 4PD). This overestimation of the phantom fat content with increasing flip angle occurs owing to T1 effects.33 The T1 of water is much longer than that of lipid; with the short TR and increasing flip angle, the water signal becomes increasingly more suppressed than the lipid signal, resulting in a higher measured percentage fat. This means that when the sequence TR is reduced to shorten scan time, the flip angle must also be reduced to prevent overestimation of the fat content due to T1 weighting. The closest agreement between MRS and mDixon and a smaller average RMS difference than the other sequences investigated was observed for the 2PD sequence with a 10° flip angle. This is a surprising result. This may be owing to the recent development of the two-point mDixon algorithm to include the static magnetic field strength (B0) inhomogeneity correction. Previously, two-point techniques have not included B0 inhomogeneity correction34 and, therefore, would be likely to agree the least with MRS 2PD acquires only two signal acquisitions, one with the fat and water signals in phase and one out of phase. The better agreement of 2PD with MRS compared with the 3PD and 4PD sequences suggests that a different algorithm may be used by the mDixon implementation on the scanner when in 2PD. The 3PD (phase) exhibited a smaller average RMS difference than in the 3PDM sequence and 4PD sequence. In the Bland–Atlman plots in Figure 4, there are no consistent differences between the two 3PD sequences and the 4PD sequence.
All mDixon results produced a similar behaviour when compared with MRS. Considering the sequences with 10° flip angles, all sequences exhibited the same pattern: increasing overestimation of the phantom fat content for the 0–20% sunflower oil phantoms and underestimation of the 40% sunflower oil phantom. Overestimation of the 0% sunflower oil phantom highlights a misregistration between water and fat. This may be caused by various factors, including spectral modelling simplification and magnetic field homogeneity. An example phantom spectrum given in Figure 1 shows that the phantom spectra are dominated by single lipid peak at 1.3 ppm. Combined with the overestimation of the 0% sunflower oil phantom, this suggests that spectrum simplification is unlikely to be the main cause of this overestimation of fat content and that magnetic field inhomogeneities may have a more significant affect.
The higher group average intramuscular fat measured using the magnitude optimized sequence (3PDM) than in the phase estimation–optimized sequence (3PDP) suggests that the phase errors caused by magnetic field inhomogeneities are one of the limiting factors of the mDixon sequences investigated. The large inhomogeneities in vivo would therefore significantly affect the accuracy of the mDixon sequences. Again, differences in spectral modelling may contribute to the difference in fat content measured between the two techniques. A two-lipid peak spectral model for MRS, corresponding to IMCL and EMCL, was employed in this study, as this is commonly performed in the literature, whereas more complex models have been described for Dixon.34 However, the lipid peaks at 1.3 and 1.2 ppm dominate the muscle spectra, and any underestimation of the lipid content by utilizing a two-lipid peak model for the MRS is likely to be minimal. The use of T2 values in the literature for T2 correction may also contribute to the disagreement between the MRS and mDixon techniques, although measuring the T2 values of the metabolites in vivo for each individual volunteer is time consuming and not representative of clinical practice.
In vivo, a significant difference was observed between all techniques with the exception of 3PDP and 4PD, which were not significantly different from each other. However, these sequences also had the largest mean difference compared with MRS, with the 2PD sequence having the best agreement with MRS. The standard deviations of the subject group percentage intramuscular fat measurements were similar across the mDixon sequences, ranging from 1.25% (4PD) to 1.94% (3PDP).
CONCLUSION
This study has compared two-point, three-point and four-point mDixon techniques with MRS in test phantoms over a range of physiologically expected fat–water ratios and in vivo for intramuscular fat quantification. In vitro, all sequences tested correlated strongly with MRS, with the 2PD in closest agreement. The flip angle was observed to have a more significant effect on agreement between mDixon and MRS than sequence type, with increasing flip angle resulting in an increasing overestimation of the fat content of the phantoms. In vivo, a significant difference was observed between MRS and all mDixon sequences investigated with the 2PD sequence in closest agreement with MRS and with comparable variability in the measured intramuscular fat across the subject group. The results of this study suggest that the two-point Dixon sequence provides the most accurate measurement of intramuscular fat and highlights the need for small flip angles to reduce fat overestimation due to T1 effects when a short TR is utilized.
Acknowledgments
The views expressed are those of the author(s) and not necessarily those of the National Health Service, the National Institute for Health Research or the Department of Health, UK.
FUNDING
Jonathan Noble was funded by a PhD studentship from the Guy's and St. Thomas's Charity, London, UK. This research was supported by the National Institute for Health Research Biomedical Research Centre at Guy's and St Thomas' NHS Foundation Trust and King's College London.
REFERENCES
- 1.Elder CP, Apple DF, Bickel CS, Meyer RA, Dudley GA. Intramuscular fat and glucose tolerance after spinal cord injury–a cross-sectional study. Spinal Cord 2004; 42: 711–16. doi: 10.1038/sj.sc.3101652 [DOI] [PubMed] [Google Scholar]
- 2.Goodpaster BH, Thaete FL, Kelley DE. Thigh adipose tissue distribution is associated with insulin resistance in obesity and in type 2 diabetes mellitus. Am J Clin Nutr 2000; 71: 885–92. [DOI] [PubMed] [Google Scholar]
- 3.Azcue MP, Zello GA, Levy LD, Pencharz PB. Energy expenditure and body composition in children with spastic quadriplegic cerebral palsy. J Pediatr 1996; 129: 870–6. [DOI] [PubMed] [Google Scholar]
- 4.Bandini LG, Schoeller DA, Fukagawa NK, Wykes LJ, Dietz WH. Body composition and energy expenditure in adolescents with cerebral palsy or myelodysplasia. Pediatr Res 1991; 29: 70–7. doi: 10.1203/00006450-199101000-00014 [DOI] [PubMed] [Google Scholar]
- 5.Johnson DL, Miller F, Subramanian P, Modlesky CM. Adipose tissue infiltration of skeletal muscle in children with cerebral palsy. J Pediatr 2009; 154: 715–20. doi: 10.1016/j.jpeds.2008.10.046 [DOI] [PMC free article] [PubMed] [Google Scholar]
- 6.Boesch C, Slotboom J, Hoppeler H, Kreis R. In vivo determination of intra-myocellular lipids in human muscle by means of localized 1H-MR-spectroscopy. Magn Reson Med 1997; 37: 484–93. [DOI] [PubMed] [Google Scholar]
- 7.Pfirrmann CW, Schmid MR, Zanetti M, Jost B, Gerber C, Hodler J. Assessment of fat content in supraspinatus muscle with proton MR spectroscopy in asymptomatic volunteers and patients with supraspinatus tendon lesions. Radiology 2004; 232: 709–15. doi: 10.1148/radiol.2323030442 [DOI] [PubMed] [Google Scholar]
- 8.Schick F, Machann J, Brechtel K, Strempfer A, Klumpp B, Stein DT, et al. MRI of muscular fat. Magn Reson Med 2002; 47: 720–7. [DOI] [PubMed] [Google Scholar]
- 9.Szczepaniak LS, Babcock EE, Schick F, Dobbins RL, Garg A, Burns DK, et al. Measurement of intracellular triglyceride stores by H spectroscopy: validation in vivo. Am J Physiol 1999; 276: E977–89. [DOI] [PubMed] [Google Scholar]
- 10.Dixon WT. Simple proton spectroscopic imaging. Radiology 1984; 153: 189–94. doi: 10.1148/radiology.153.1.6089263 [DOI] [PubMed] [Google Scholar]
- 11.Glover GH. Multipoint Dixon technique for water and fat proton and susceptibility imaging. J Magn Reson Imaging 1991; 1: 521–30. [DOI] [PubMed] [Google Scholar]
- 12.Ma J. Dixon techniques for water and fat imaging. J Magn Reson Imaging 2008; 28: 543–58. doi: 10.1002/jmri.21492 [DOI] [PubMed] [Google Scholar]
- 13.Reeder SB, Alley MT, Pelc NJ, editors. Water and fat SSFP imaging with four-point Dixon techniques. 10th Annual Meeting of ISMRM; 2002. [Google Scholar]
- 14.Reeder SB, Pineda AR, Wen Z, Shimakawa A, Yu H, Brittain JH, et al. Iterative decomposition of water and fat with echo asymmetry and least-squares estimation (IDEAL): application with fast spin-echo imaging. Magn Reson Med 2005; 54: 636–44. doi: 10.1002/mrm.20624 [DOI] [PubMed] [Google Scholar]
- 15.Reeder SB, McKenzie CA, Pineda AR, Yu H, Shimakawa A, Brau AC, et al. Water–fat separation with IDEAL gradient-echo imaging. J Magn Reson Imaging 2007; 25: 644–52. doi: 10.1002/jmri.20831 [DOI] [PubMed] [Google Scholar]
- 16.Reeder SB, Sirlin CB. Quantification of liver fat with magnetic resonance imaging. Magn Reson Imaging Clin N Am 2010; 18: 337–57, ix. doi: 10.1016/j.mric.2010.08.013 [DOI] [PMC free article] [PubMed] [Google Scholar]
- 17.Karampinos DC, Baum T, Nardo L, Alizai H, Yu H, Carballido-Gamio J, et al. Characterization of the regional distribution of skeletal muscle adipose tissue in type 2 diabetes using chemical shift-based water/fat separation. J Magn Reson Imaging 2012; 35: 899–907. doi: 10.1002/jmri.23512 [DOI] [PMC free article] [PubMed] [Google Scholar]
- 18.Kovanlikaya A, Mittelman SD, Ward A, Geffner ME, Dorey F, Gilsanz V. Obesity and fat quantification in lean tissues using three-point Dixon MR imaging. Pediatr Radiol 2005; 35: 601–7. doi: 10.1007/s00247-005-1413-y [DOI] [PubMed] [Google Scholar]
- 19.Wren TA, Bluml S, Tseng-Ong L, Gilsanz V. Three-point technique of fat quantification of muscle tissue as a marker of disease progression in Duchenne muscular dystrophy: preliminary study. AJR Am J Roentgenol 2008; 190: W8–12. doi: 10.2214/AJR.07.2732 [DOI] [PubMed] [Google Scholar]
- 20.Fischmann A, Kaspar S, Reinhardt J, Gloor M, Stippich C, Fischer D. Exercise might bias skeletal-muscle fat fraction calculation from Dixon images. Neuromuscular Disord 2012; 22(Suppl. 2): S107–10. doi: 10.1016/j.nmd.2012.05.014 [DOI] [PubMed] [Google Scholar]
- 21.Willis TA, Hollingsworth KG, Coombs A, Sveen ML, Andersen S, Stojkovic T, et al. Quantitative muscle MRI as an assessment tool for monitoring disease progression in LGMD2I: a multicentre longitudinal study. PLoS One 2013; 8: e70993. doi: 10.1371/journal.pone.0070993 [DOI] [PMC free article] [PubMed] [Google Scholar]
- 22.Wokke BH, Bos C, Reijnierse M, van Rijswijk CS, Eggers H, Webb A, et al. Comparison of dixon and T1-weighted MR methods to assess the degree of fat infiltration in duchenne muscular dystrophy patients. J Magn Reson Imaging 2013; 38: 619–24. doi: 10.1002/jmri.23998 [DOI] [PubMed] [Google Scholar]
- 23.Fischmann A, Hafner P, Fasler S, Gloor M, Bieri O, Studler U, et al. Quantitative MRI can detect subclinical disease progression in muscular dystrophy. J Neurol 2012; 259: 1648–54. doi: 10.1007/s00415-011-6393-2 [DOI] [PubMed] [Google Scholar]
- 24.Price DI, Patel D, Taylor SA, Halligan S, Lally P, Bainbridge A, et al. Pelvic floor atrophy assessment using a 2-point Dixon technique to measure muscle fat fraction. No. 633. Abstracts of the 30th Annual Scientific Meeting of the European Society for Magnetic Resonance in Medicine and Biology (ESMRMB); 3–5 October 2013; Toulouse, France. MAGMA 2013; 26(Suppl. 1): 4–535. [PubMed]
- 25.Bernard CP, Liney GP, Manton DJ, Turnbull LW, Langton CM. Comparison of fat quantification methods: a phantom study at 3.0 T. J Magn Reson Imaging 2008; 27: 192–7. doi: 10.1002/jmri.21201 [DOI] [PubMed] [Google Scholar]
- 26.Reeder SB, Wen Z, Yu H, Pineda AR, Gold GE, Markl M, et al. Multicoil Dixon chemical species separation with an iterative least-squares estimation method. Magn Reson Med 2004; 51: 35–45. doi: 10.1002/mrm.10675 [DOI] [PubMed] [Google Scholar]
- 27.Xiang QS, An L. Water–fat imaging with direct phase encoding. J Magn Reson Imaging 1997; 7: 1002–15. [DOI] [PubMed] [Google Scholar]
- 28.Vanhamme L, van den Boogaart A, Van Huffel S. Improved method for accurate and efficient quantification of MRS data with use of prior knowledge. J Magn Reson 1997; 129: 35–43. [DOI] [PubMed] [Google Scholar]
- 29.Naressi A, Couturier C, Devos JM, Janssen M, Mangeat C, de Beer R, et al. Java-based graphical user interface for the MRUI quantitation package. MAGMA 2001; 12: 141–52. [DOI] [PubMed] [Google Scholar]
- 30.Rosset A, Spadola L, Ratib O. OsiriX: an open-source software for navigating in multidimensional DICOM images. J Digit Imaging 2004; 17: 205–16. doi: 10.1007/s10278-004-1014-6 [DOI] [PMC free article] [PubMed] [Google Scholar]
- 31.Krssak M, Mlynarik V, Meyerspeer M, Moser E, Roden M. 1H NMR relaxation times of skeletal muscle metabolites at 3 T. MAGMA 2004; 16: 155–9. doi: 10.1007/s10334-003-0029-1 [DOI] [PubMed] [Google Scholar]
- 32.Bland JM, Altman DG. Statistical methods for assessing agreement between two methods of clinical measurement. Lancet 1986; 1: 307–10. [PubMed] [Google Scholar]
- 33.Liu CY, McKenzie CA, Yu H, Brittain JH, Reeder SB. Fat quantification with IDEAL gradient echo imaging: correction of bias from T(1) and noise. Magn Reson Med 2007; 58: 354–64. doi: 10.1002/mrm.21301 [DOI] [PubMed] [Google Scholar]
- 34.Eggers H, Brendel B, Duijndam A, Herigault G. Dual-echo Dixon imaging with flexible choice of echo times. Magn Reson Med 2011; 65: 96–107. doi: 10.1002/mrm.22578 [DOI] [PubMed] [Google Scholar]


